Unofficial Seller Management
Image Theft
3 Signals to Spot Unauthorized Sellers: Images, Prices, and Reviews

💡 In this article, you can check the following contents.
Image Signals — Visual clues that differ from the genuine product
Price Signals — Reading outlier patterns
Review Signals — Finding traces in consumer images
Identification routines that practitioners can apply immediately
Unauthorized sellers leave patterns
“This seller is somewhat suspicious…”
If you are a brand manager, you have probably experienced this situation at least once. The product thumbnail image is subtly different from the genuine one, and even in the detail page image, the label position or color tone looks different. The price is abnormally low compared to the genuine price, and in reviews, clues that suggest a counterfeit are sometimes found in photos or phrases left by customers. For example, a review photo casually uploaded by a consumer might show differences in the expiration date font or label cutting lines, or comments like “The scent is different from the original genuine product” or “The packaging print is smudged” are repeated.
In such cases, the possibility of being an unauthorized seller is high enough, but if there is a lack of visual and data-based evidence to compare with the genuine product, it is difficult to lead to platform reporting or internal action. Consequently, even after clearly recognizing the problem, a state of 'having conviction but no evidence' continues.
These cases are frequently found in actual monitoring conducted by Reatrics with brands. This is when a specific seller uses the genuine image as is, but repeatedly registers images with slightly different background tones or label printing positions across multiple platforms. The price was formed on average 20-30% lower than the official mall. Individually, it looks like a natural variation, but as a pattern, it stands out as a clear 'violation signal'.
Ultimately, what brand managers need is not 'intuition' but the accumulation of evidence.
When elements such as label position, font spacing, price fluctuations, and review clues are gathered, you can clearly prove "why this seller is a problem" at the platform reporting or internal review stage. In this article, we have summarized the ‘3 signals to suspect unauthorized sellers’ that constitute this evidence.
Understanding these signals will reduce the frustrating situation of "being suspicious but having no evidence" and increase the success rate of reporting, approval, and action.
Image Signal — Visual Clues Different from Genuine Products
The first thing that stands out when identifying unauthorized sellers is the subtle differences in images. While some use genuine images as they are, others re-register them after slightly adjusting the background color, label position, font spacing, etc., to evade AI detection or optimize platform exposure. It is not easy for managers to identify these variations immediately. This is because although it looks genuine, a detailed look reveals that a 'different version of the image' exists.
For example, among the cases monitored by Reatrics, there was a seller who used the same product cut as the official mall image but uploaded it after slightly adjusting the background brightness or blurring the area around the brand logo. To the naked eye, it looks like a simple difference in image quality, but in AI similarity analysis, it was confirmed as a modified version of the same original image. This method is a representative camouflage technique that avoids duplicate image detection by the platform while making it look like a genuine product.
Another type is the difference in label position and ratio. For example, there are cases where the label of a cosmetics container is 1–2 mm higher than the genuine one, or an image retaken with a slightly reduced printing ratio is used. On the surface, there doesn't seem to be a big difference, but when comparing the same products side-by-side, it is immediately noticeable. In particular, if the label printing line or the edge of a shape is slightly cut off, or if the font spacing is different, there is a high probability that it is an image produced separately without referring to the original genuine product.
Reatrics' AI Image Similarity Diagnosis relies on these 'subtle visual clues' as evidence. Based on the genuine database image, the AI calculates and scores the similarity at the pixel level with the seller's image registered online. For example, if the background is different even though it is the same product and the similarity score is recorded at around 0.7, this indicates the possibility that the same image has been edited.
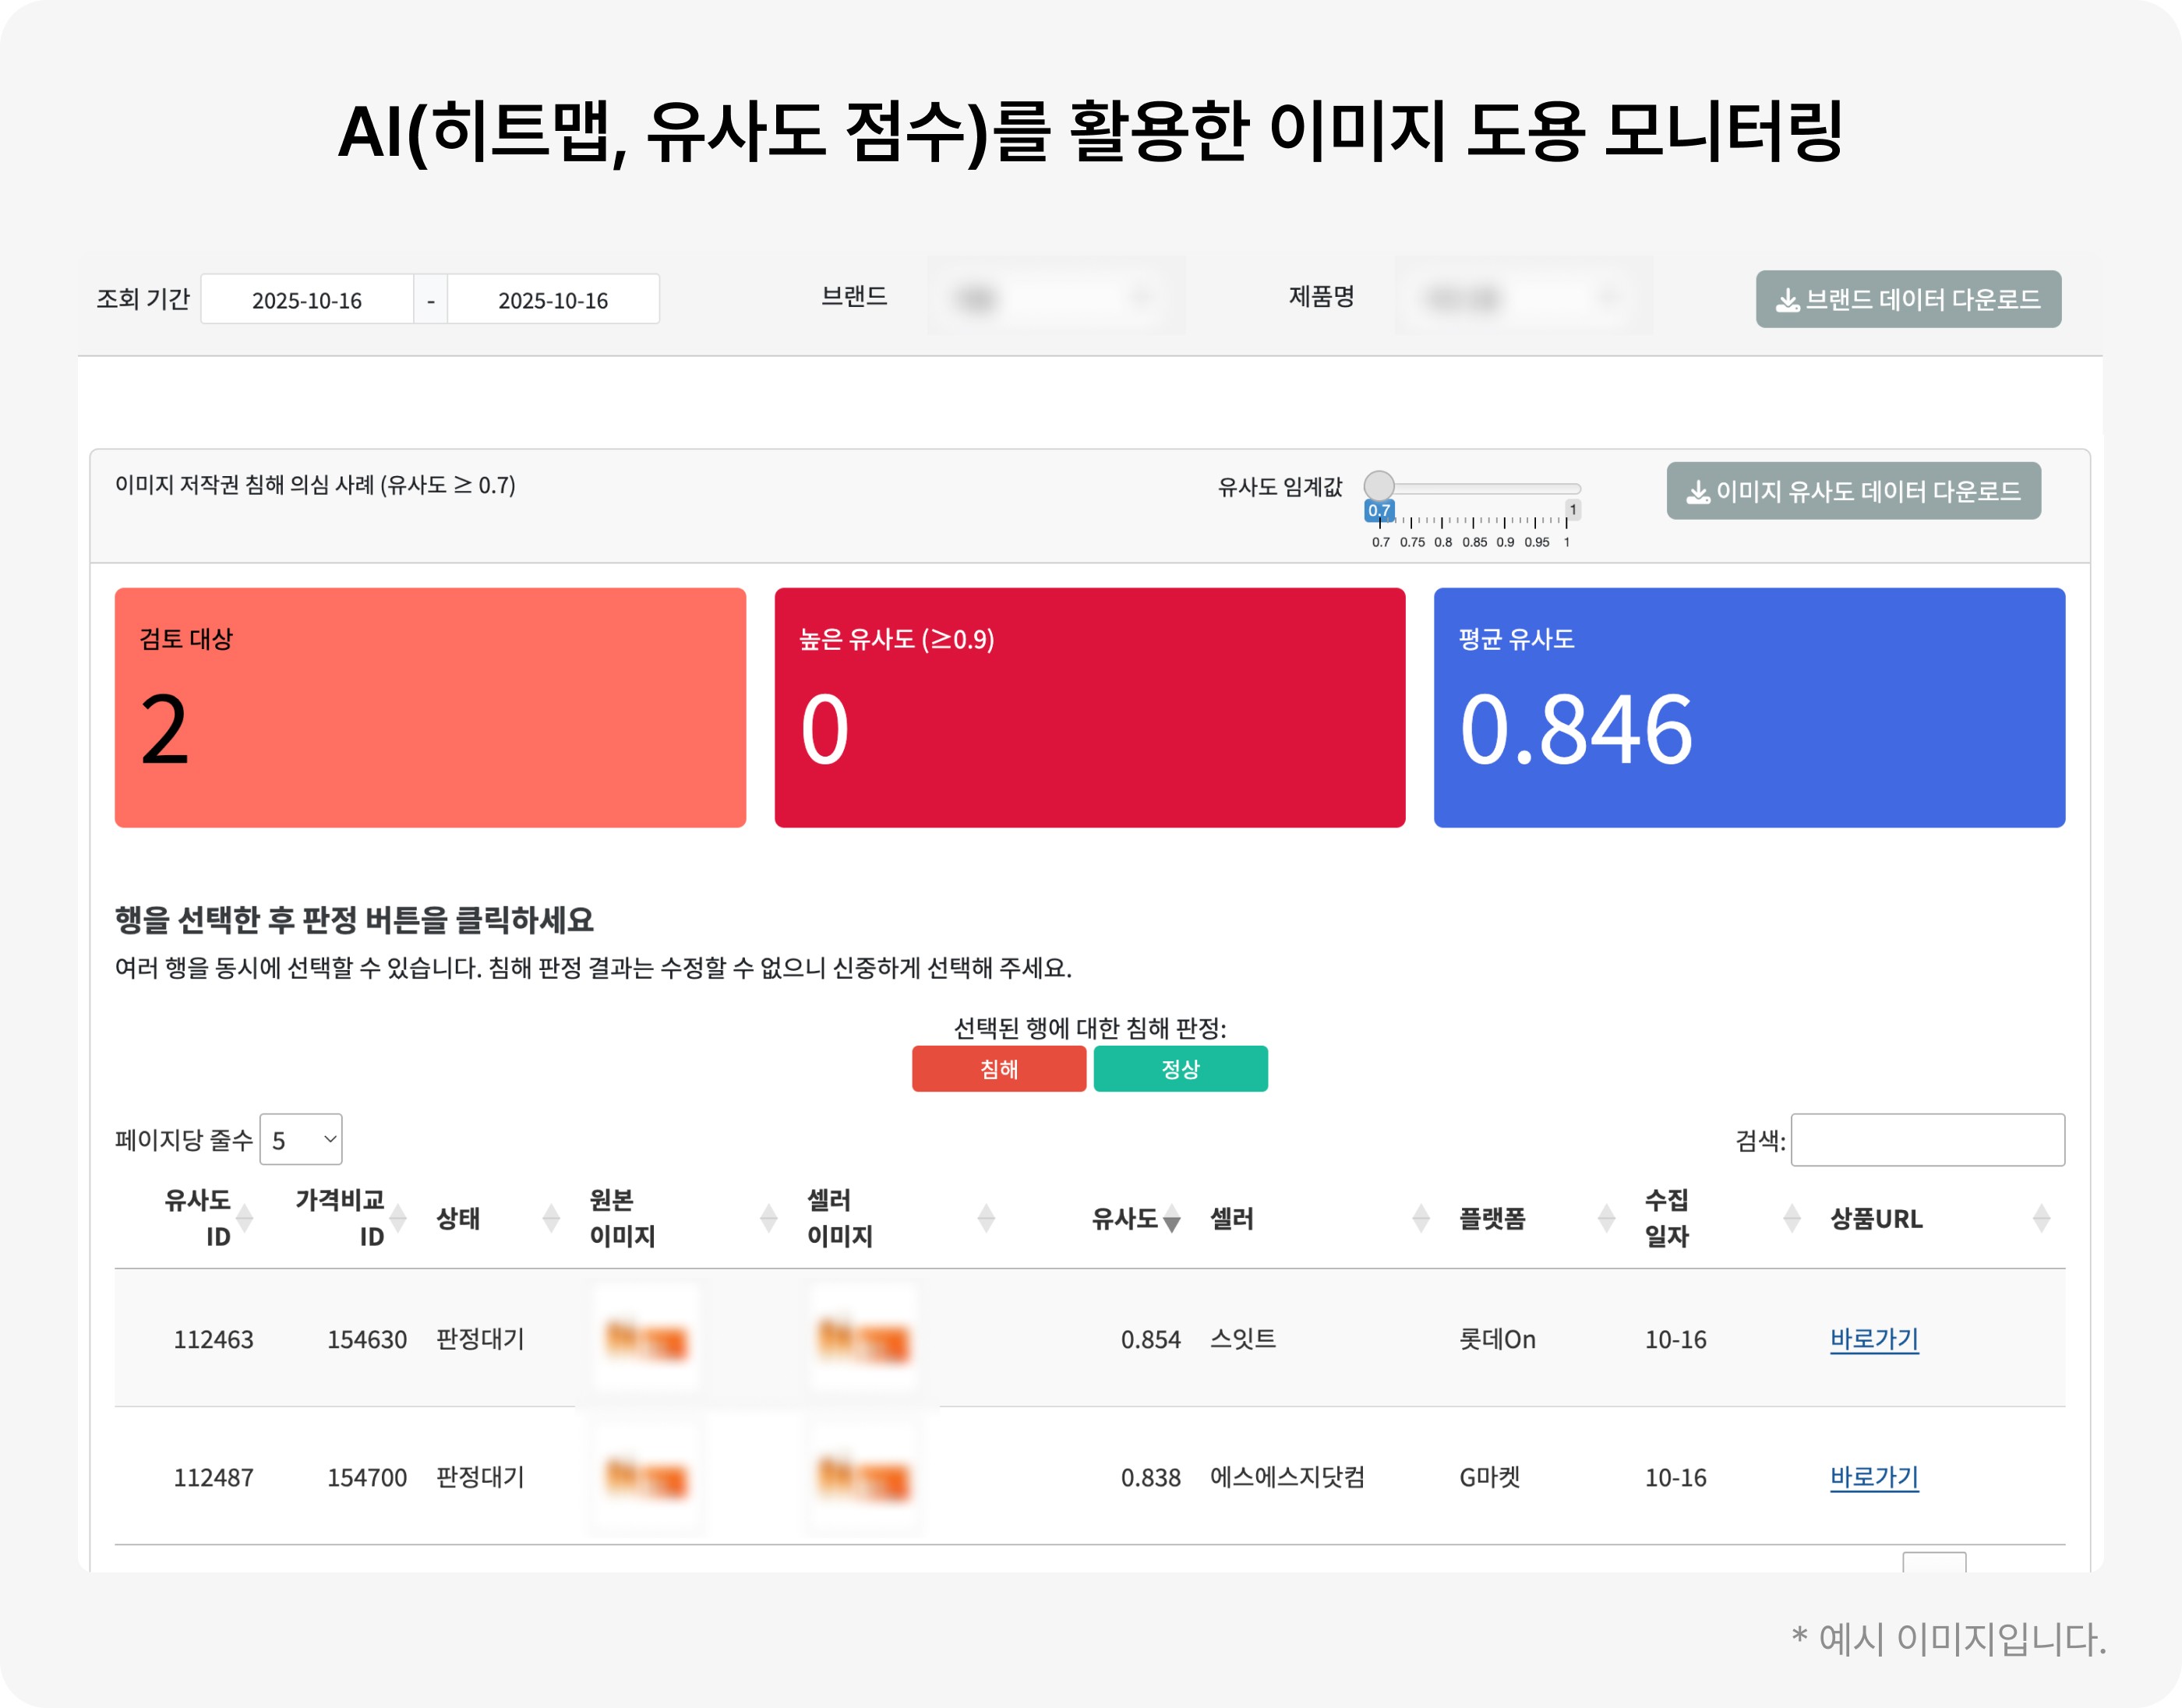
By utilizing Reatrics' heatmap feature together, you can visually check which areas have been modified differently. Subtle traces of modification around the background, label, and logo are displayed as red areas, allowing managers to verify the differences in just a few seconds.

As such, the image signal is not just a simple 'difference between genuine and non-genuine', but a trace left by unauthorized sellers in the process of modifying or recycling genuine images. Images are a means of visually conveying the brand's trust, but at the same time, they also serve as the clearest clue to detecting counterfeiting and theft.
Price Signal — Reading Outlier Patterns
Price is the simplest and fastest signal for suspicion. The question is not 'how low is it' but 'in what flow did it go down'. Because unauthorized sellers aim for short-term traffic, they often repeat abnormal price drops in line with a regular cycle or specific timing. Unlike temporary discounts offered by official malls or authorized resellers, price drops by unauthorized sellers are characterized by the fact that they occur independently of the promotion schedule.
In the actual market, a pattern is sometimes observed where the price of a specific product drops sharply on the same day of the week or at a specific time every week, and then recovers shortly after. On the surface, it looks like a simple 'discount', but there are cases where the same seller uses multiple accounts to cross-expose prices under different names. If one account is restricted, they reappear under a different name, attempting to resell at a certain percentage (e.g., about 25% lower range) of the regular price each time. In this case, the key point for managers to pay attention to is not the 'value' of the price but the 'pattern'. Rather than a single sharp drop, you must observe the repeated rhythm and the regularity that appears on specific days, times, and immediately before and after promotions.
In addition, cases where a price drops sharply in a short period and is then deleted, or where the same product is re-registered under a different URL, may be attempts to secure inbound traffic through price manipulation.
Reatrics' Price Monitoring Feature automates this process. It tracks the lowest price of each product in real-time, and if an abnormal section is detected, it is marked separately on the graph. Through this, managers can understand 'deviation rate compared to average price', 'timing of sharp price drop', and 'repetition cycle' at a glance.
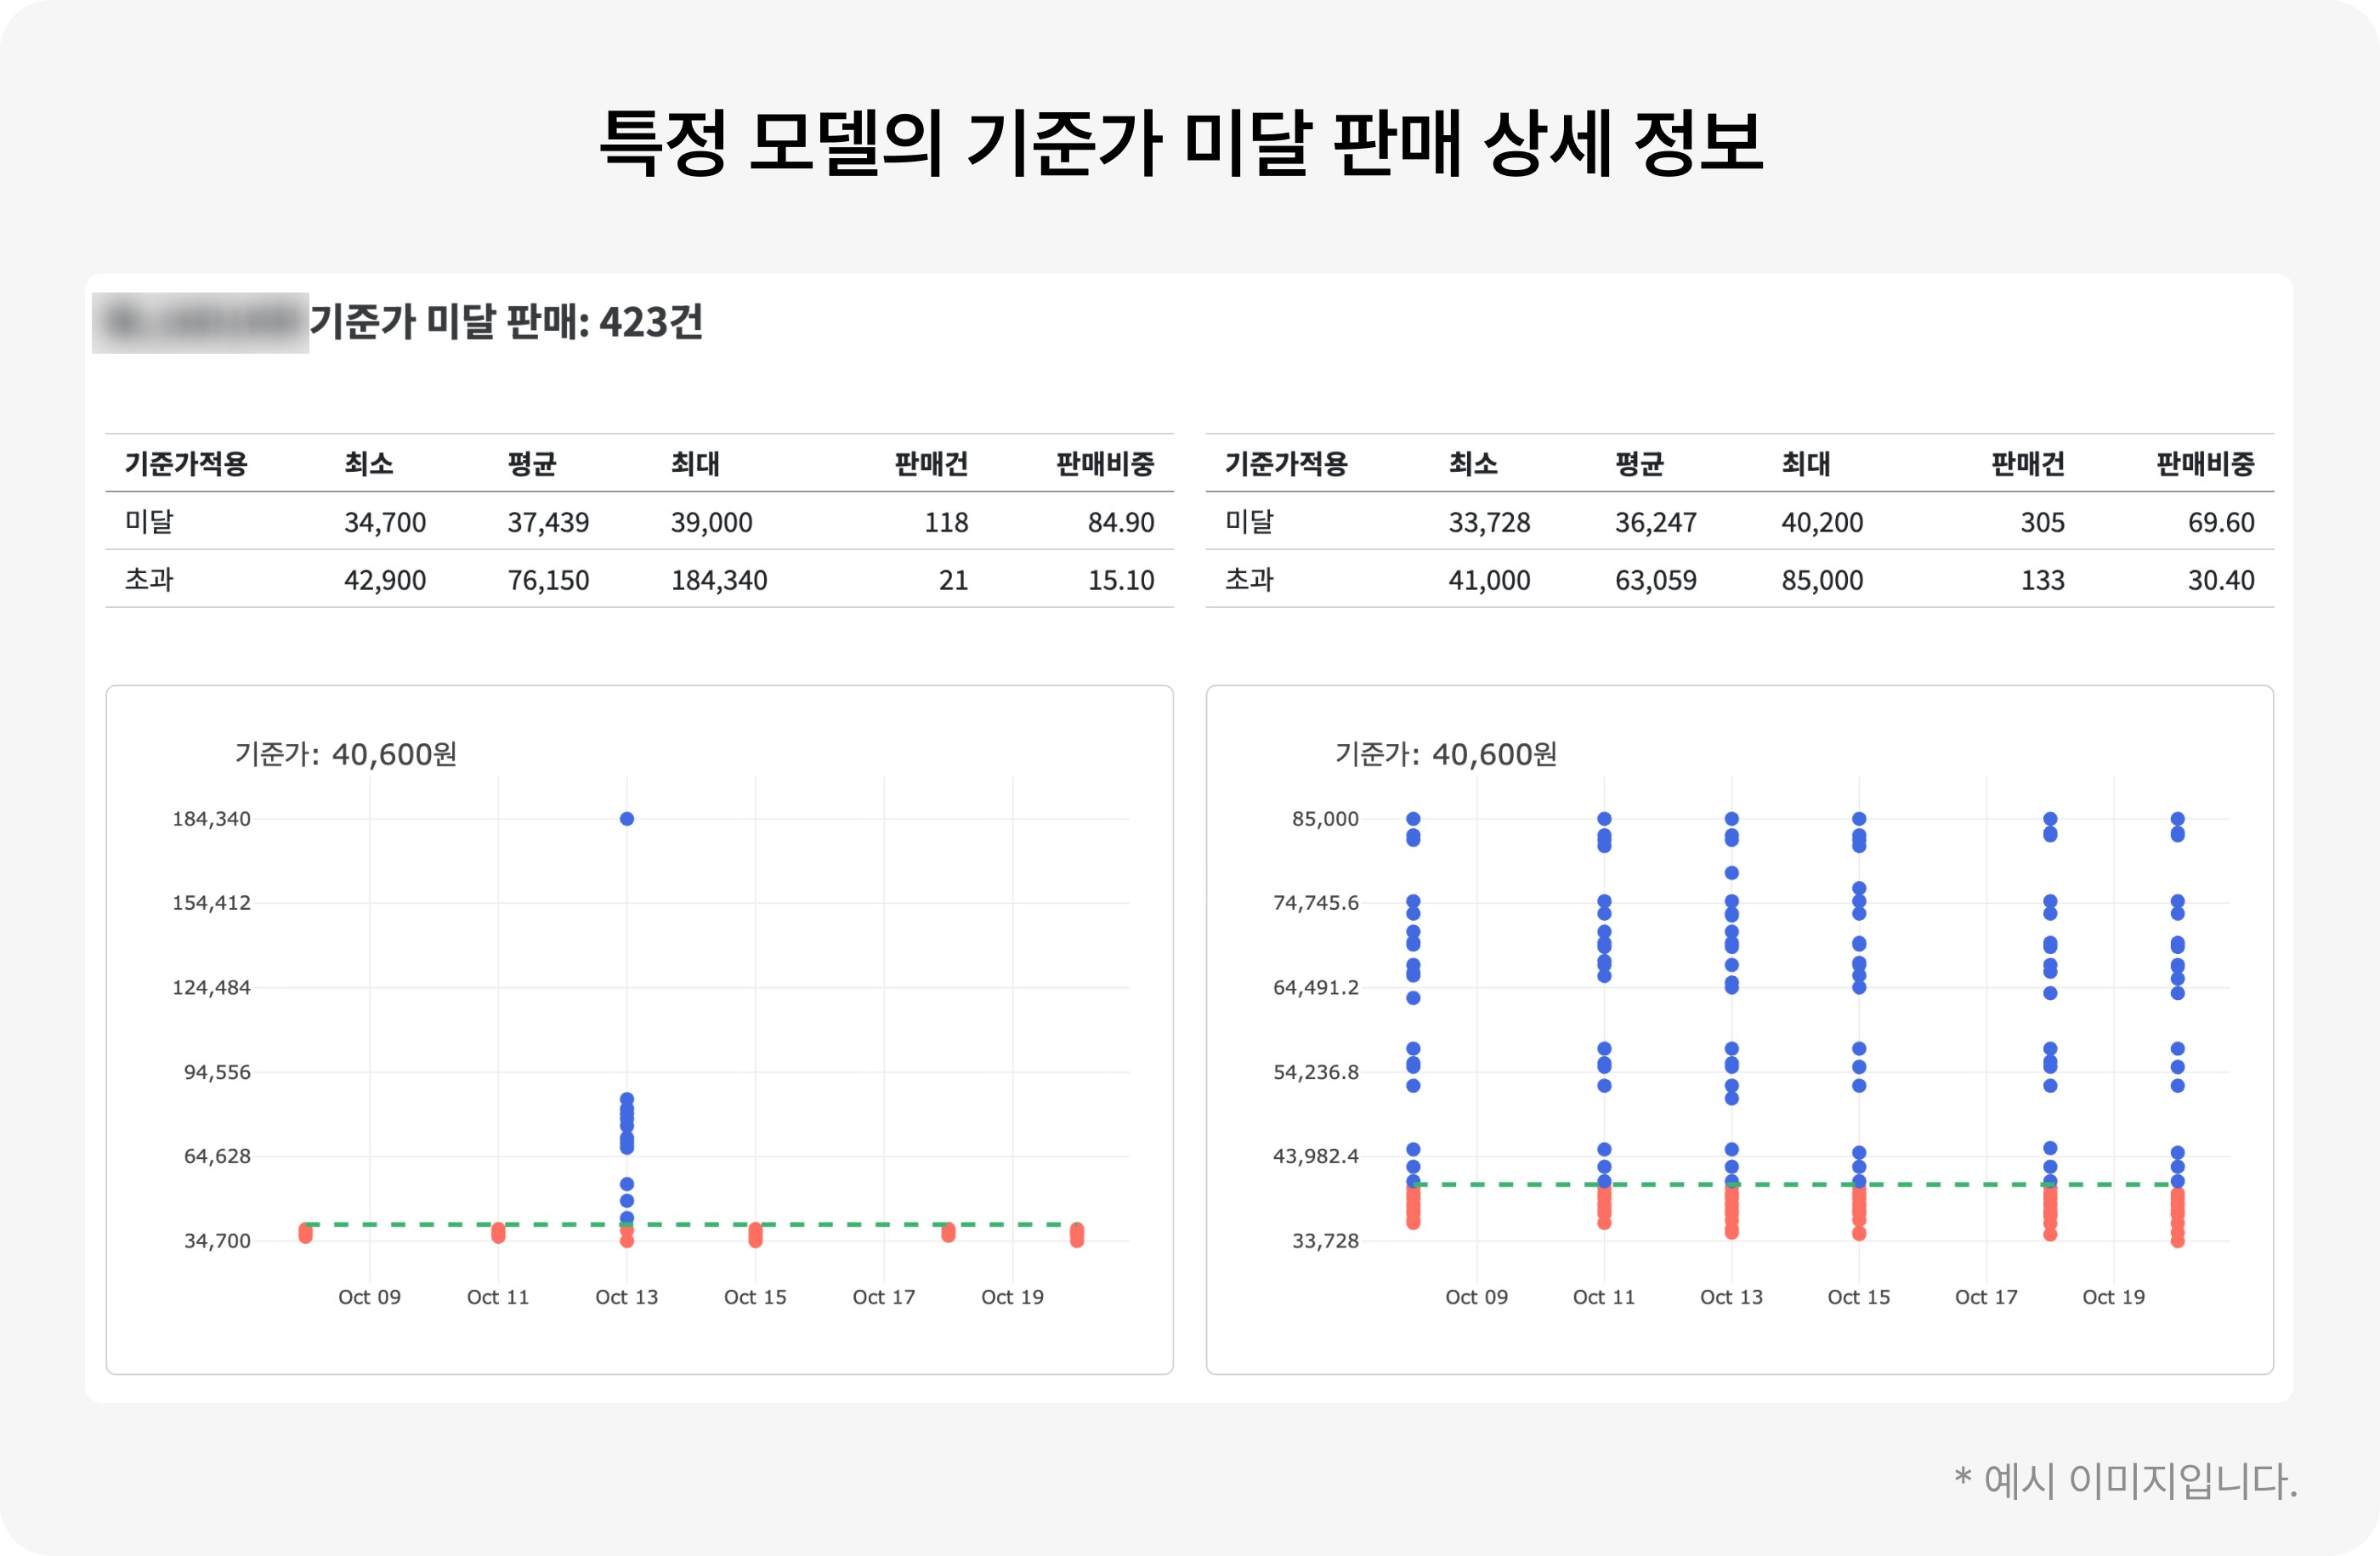
In particular, cases where only the option was changed and re-registered under the same URL, or cases where the link changed but the same image was maintained, are automatically connected within the data. By reading price signals in such detail, you can approach it not as simple "low-price selling" but as a "price disruption pattern".
There can be various reasons why a price is low, but sales channels that remain consistently low compared to the genuine price, accounts that plummet regardless of promotion schedules, and identical price groups appearing simultaneously on multiple platforms are all red flags. Reatrics visualizes these trends, helping managers prove the behavior of suspicious sellers with data without relying on individual screenshots.
In the end, price is not just a simple number, but the first data trace that reveals the behavior patterns of unauthorized sellers. If clues of modification are left in images, intended repetition is left in prices. When these two signals appear together, managers secure the basis to classify them as 'sellers with a high probability of violation' rather than simple outliers.
Review Signal — Finding Traces in Consumer Images
Reviews are not simple satisfaction evaluations, but practical evidence data that can identify counterfeits and unauthorized sellers. Hidden in the review photos left by consumers are clues that even they did not realize. Details different from the genuine product, such as the thickness of the expiration date print, label cutting lines, the adhesion form of the seal, and the quantity of components, are often exposed as they are. In particular, because reviews accumulate quickly for popular products, when these small differences accumulate, they appear as patterns.

For example, let's assume a consumer left a review saying, “The scent is different from the genuine product I usually use” or “The packaging material is thinner than the previous product.” The consumer merely left a simple review of their experience, but from the brand's perspective, that review can be an important clue to pinpointing the unauthorized seller. This is because products flowing from outside the distribution network may have subtle differences in packaging, texture, and color compared to genuine ones.
At this point, rather than looking at one or two reviews, checking whether reviews with similar content appear repeatedly can provide a clear basis for suspicion. Reatrics' AI Image Similarity Diagnosis Service can automatically compare these review images with genuine database images to detect visual differences occurring in products outside the distribution channel. The AI compares labels, packages, printed areas, etc., of review images uploaded by consumers with genuine standards to provide similarity scores and heatmaps. With this information, managers can quickly flag 'suspicious seller product lines' and secure visual evidence when reporting to platforms or writing internal reports.
In addition, the review content itself becomes a useful signal. If phrases like “Is this genuine?”, “The scent is different”, or “The packaging condition is strange” are repeated in the text reviews left by consumers, it can be seen as a signal of potential counterfeiting rather than simple customer dissatisfaction.
By automatically collecting and tagging these review patterns, you can build a watchlist of suspicious sellers without having to read every review manually. Ultimately, the value of the review signal is that managers can convert traces casually left by consumers into evidence.
In other words, reviews are no longer just 'the customer's voice', but the most human data for finding traces of unauthorized sellers. If price is a signal revealed in numbers, reviews are a signal combined with senses and experience. The moment these two align, that seller shifts from being 'suspected' to 'subject to verification'.
A Identification Routine That Managers Can Apply Immediately
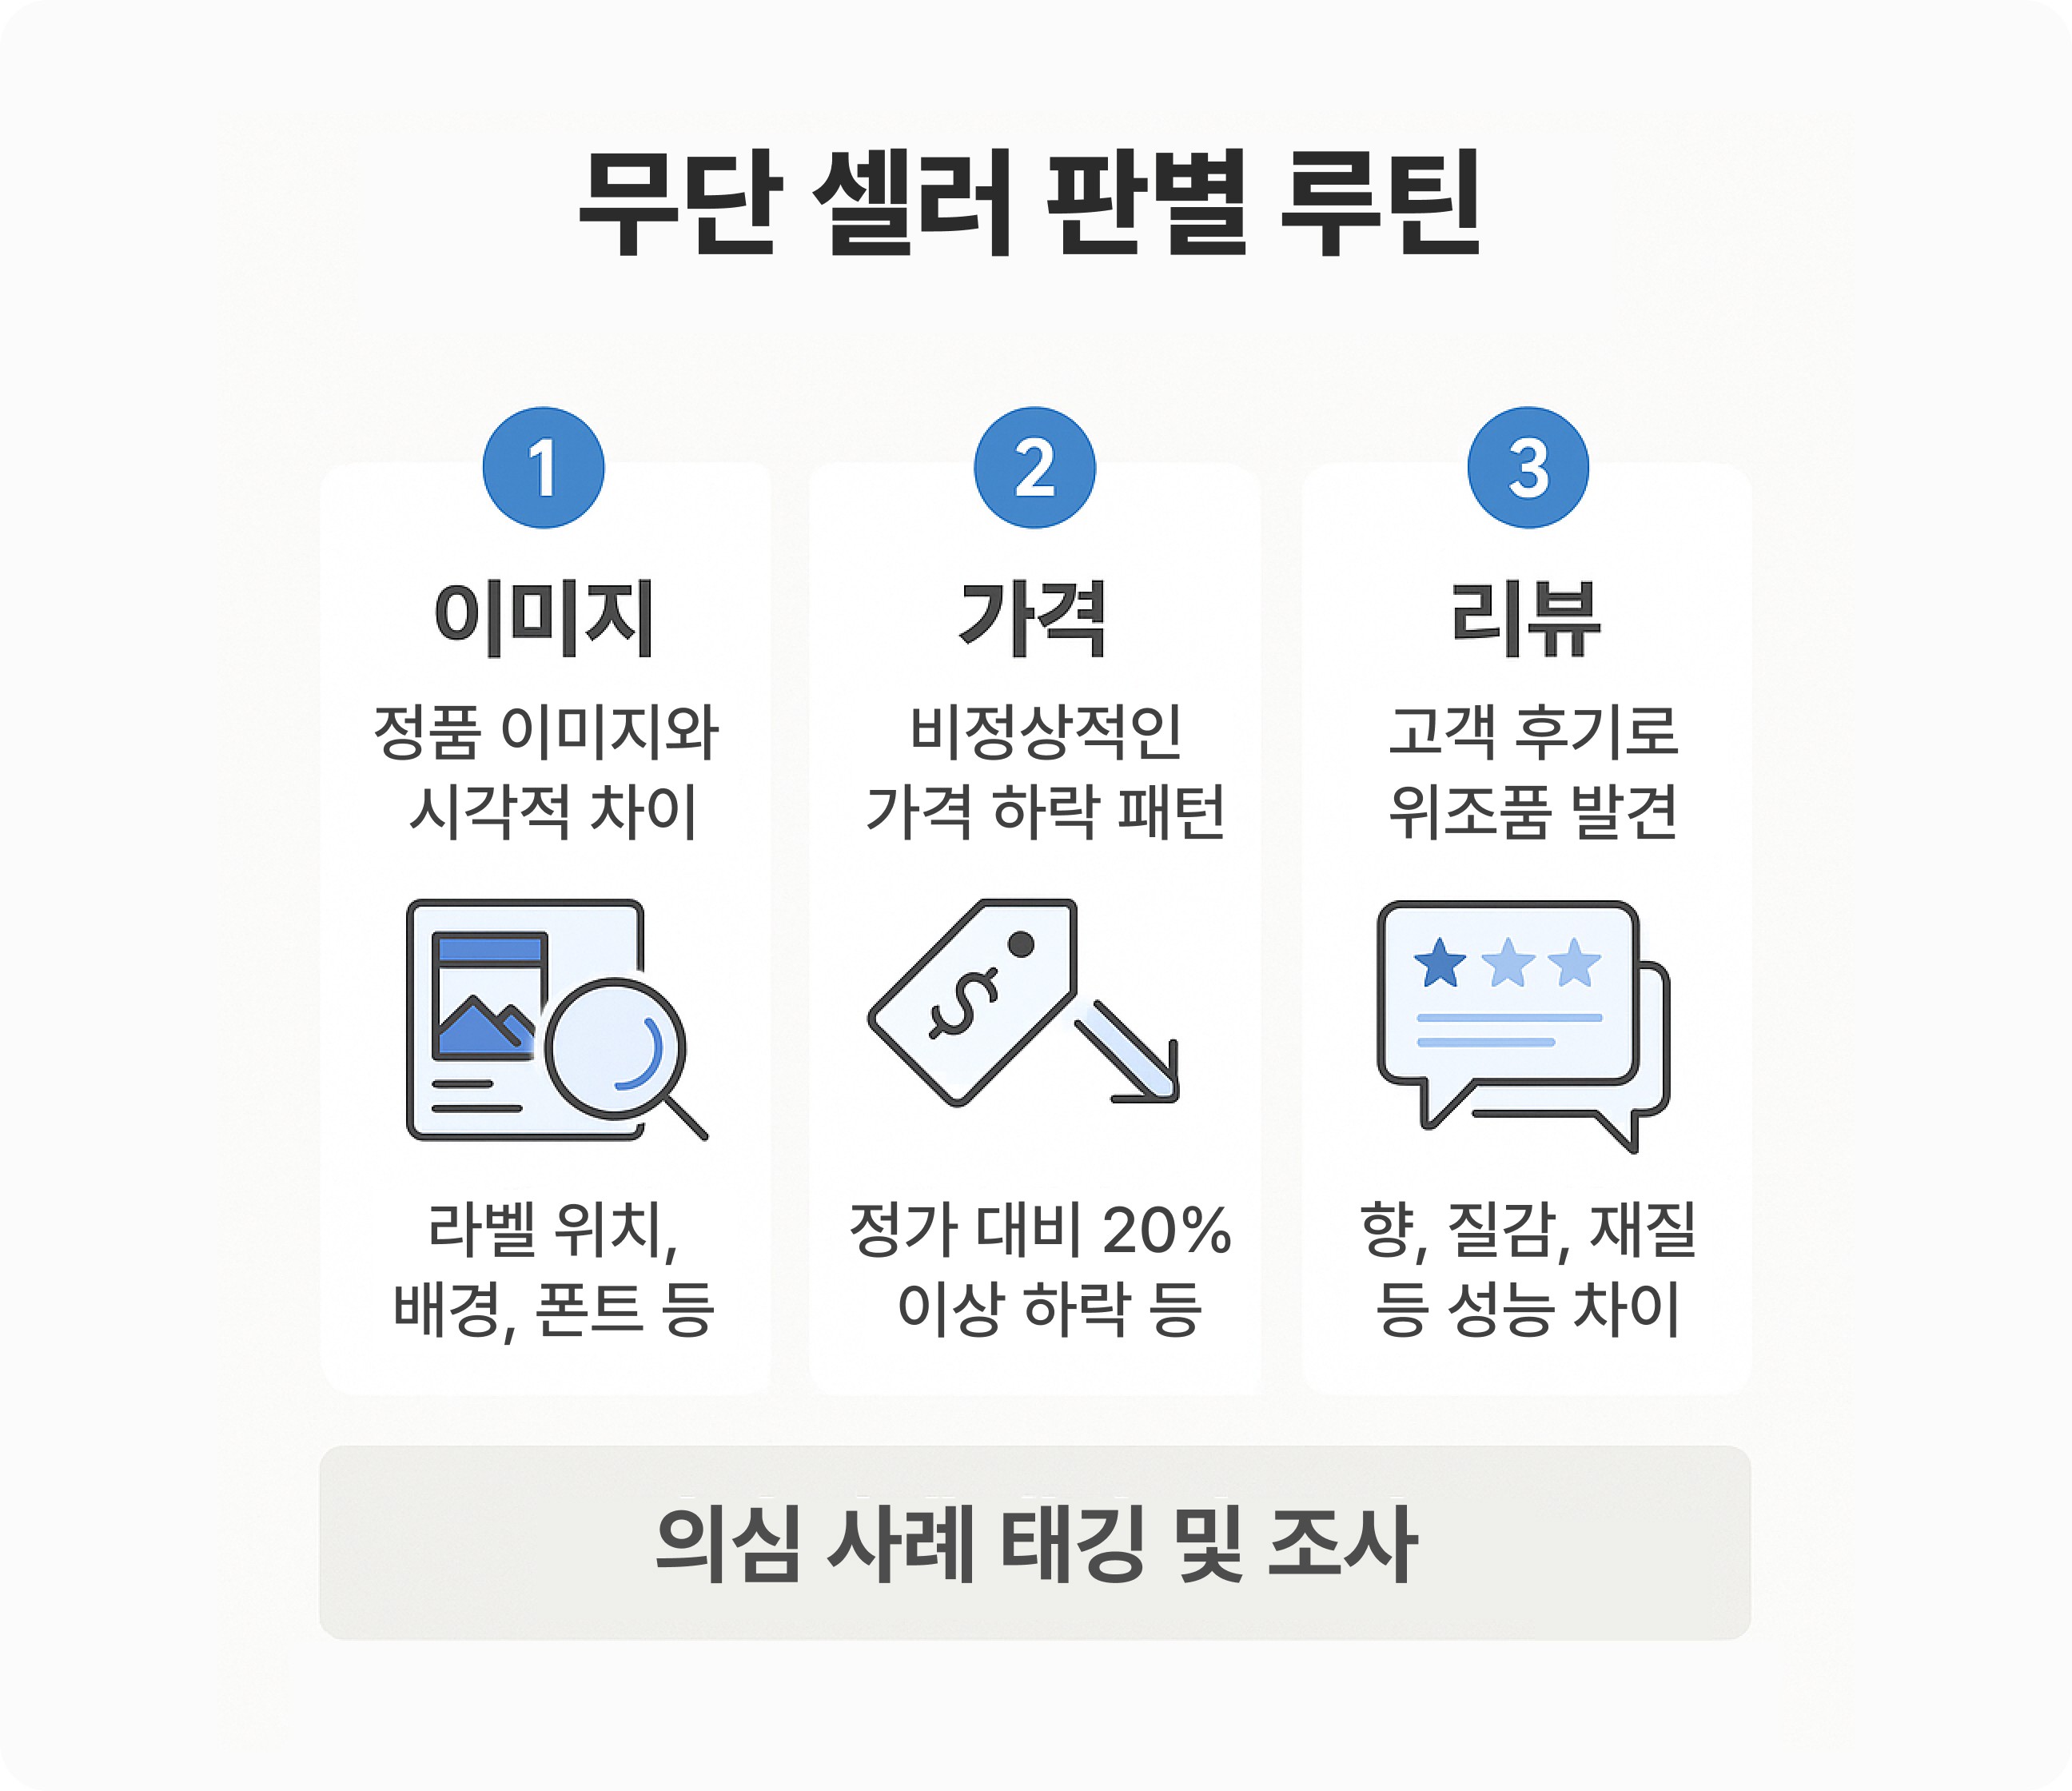
Sifting out unauthorized sellers starts with a procedure that has an order and criteria, not 'intuition'. Reatrics structures this into three stages: Image → Price → Review. By following this order, grey areas are reduced, and suspicion signals can be proven with data.
First is the image stage. By comparing product thumbnails and detail page images with the genuine database, you need to find the points where visual consistency is broken. Typically, subtle differences can be detected in label positions, font thickness, background color tones, print quality, and expiration date positioning. When these differences accumulate, they are displayed as a "similarity drop section compared to the genuine image." In particular, if reusing the same image across multiple accounts or traces of editing some genuine images (adjusting logo size, margins, etc.) are repeated, it should be classified as 'suspicion'.
However, if the evidence is insufficient or it is difficult to judge due to differences in resolution, it should be left as a target for re-examination. This division must be clear to reduce judgment errors during subsequent reporting or complaining processes.
Next is the price stage. Here, we should look at the structural pattern of the drop compared to the normal price, not simply "it is cheap." For example, if a specific seller repeats a 20-30% drop on the same day every week, or drops the price independently of the promotion schedule, it can be classified as a 'price outlier'. Since a single sharp drop cannot be conclusive, "whether there is a repeated drop" should be recorded together.
Also, if the same product is re-registered under a different URL, or if only options are changed to maintain the same price range, there is a high possibility of price distortion due to cross-exposure. In this case, monitoring should be conducted to see if the same pattern is repeated in the future.
Finally, the review stage. Traces of violations that brands are likely to miss are left in consumer feedback. If sentences like “Is this genuine?”, “The scent is different”, or “The packaging is thinner than the genuine product” are repeated, or if the expiration date font, label cutting line, or sealing seal in the review image is different from the genuine one, they should be classified as a 'suspicious seller'.
In particular, if multiple consumers leave similar content, or if the same packaging difference appears in multiple reviews, the basis for viewing it as a counterfeit or unauthorized distribution circumstance is strengthened. However, if clear visual differences are not confirmed, or if it is difficult to judge due to different shooting conditions such as lighting and angles, it is a rule to classify them into the 'suspected group' to reduce the risk of false reporting.
The information secured through these three steps leads in the order of: tagging suspicious groups → scoring → packaging evidence (including screenshots, links, heatmaps, and graphs) → internal approval and platform reporting. Once this routine is established, managers can manage complex judgment processes as a standardized data flow.
Ultimately, the important thing is not conviction, but having criteria to systematically manage uncertainty.
Unauthorized Sellers Leave Patterns
Unauthorized sellers do not hide perfectly. Images leave traces, prices reveal patterns, and reviews leave statements. When looking at these three signals together, the manager becomes the subject of judgment, not just a simple observer. Subtle differences in product thumbnails, repeated price drops, and packaging discrepancies in reviews are each just small clues, but when combined, they become a single consistent flow. This flow is precisely the basis for narrowing down the suspicious groups and establishing priorities for response.
Reatrics structures this process into an automated routine, connecting image, price, and review data on a single screen and providing early warnings. However, the final judgment is made under the brand's policy and responsibility, not by the system. While the AI presents clues, Reatrics' principle is that the power of decision-making remains with the manager.
In the end, the key to responding to unauthorized sellers is not technology, but the power of interpretation. The initiative in the market returns to the manager who knows how to read the signals.