Price Management
Why do Coupang Rocket Delivery prices suddenly crash one day?

💡 In this article, you can check the following content.
The essence of Coupang price monitoring – 'Who, where, and when' touched the price first
Four observation points to read the 'movement' of Coupang prices
To avoid missing Coupang price drops – A 'structure that records the flow' is necessary
Conclusion: Price should be read as a flow, not a result
When brand practitioners check prices on Coupang, the first metric they usually look at is the 'lowest price'. This is because they can see at a glance which seller is offering the lowest price and whether that price meets their brand's standard price. The problem is that by the time the practitioner sees the lowest price, the price has often already dropped. In other words, key information—such as when the price change started, which seller adjusted first, and whether movements on other platforms had an impact—is already blurred by the time it is discovered.
Especially for sellers operating multiple platforms simultaneously, it is common to see prices on Naver, their own online mall, and Coupang changing at the same time due to platform integration or automated pricing settings. Therefore, simply looking at "what the lowest price on Coupang is right now" cannot explain why the price dropped, and it is easy to miss the starting point of the change.
Furthermore, price adjustments can occur at times when real-time response is difficult, such as on weekends or after working hours, meaning prices can change multiple times within a single day. In this situation, it is difficult to identify the starting point of the change or the adjustment patterns of individual sellers simply by looking at "what the current lowest price is."
Therefore, the key to Coupang price monitoring is not the absolute price, but how the price moved—that is, the flow of identifying "when, where, and who touched the price first." Reading this flow allows you to understand each seller's price adjustment patterns faster and avoid missing changes that appear before Coupang and Rocket Delivery prices fall below the standard.
The Essence of Coupang Price Monitoring – 'Who, Where, and When' Touched the Price First
As mentioned earlier, when monitoring Coupang prices, simply checking 'what today's lowest price is' quickly reveals its limitations. Questions more frequently encountered in practice are closer to flows like "Why did this seller's product price drop so much?" or "Which seller broke the price first?" Therefore, the essence of price monitoring is not an abstract concept, but is closer to finding which seller, on which platform, and at what timing touched the price first.
Who Touched the Price – Why Seller-Specific Patterns Matter
Looking at Coupang's price drop history, there are cases where a new seller appears and cuts the price, but in practice, it is much more common to observe a familiar seller changing the price first on another channel.
It is easy for anyone to confirm cases where the same seller operates different prices simultaneously across platforms, such as:
Maintaining the regular price on Naver Smart Store
Increasing the discount rate on their own online mall
Lowering only specific options on Coupang
In these cases, "why today's lowest price on Coupang dropped" cannot be explained by numbers. You must first identify who initiated the price movement to understand the flow.
Where It Changed First – Why You Must Look at the Flow Between Platforms Together
Even if Coupang's price has dropped, it is difficult to assume that the change occurred solely within Coupang. On the front lines of various brands, a repeating pattern is observed where prices move on external platforms first, and then, almost at the same time, Rocket Delivery prices are adjusted as well.
A typical pattern is that the price of a specific model lowers first on Naver, Danawa, or a brand's own online mall, and within a short period, drops to a similar level on Coupang. Seeing this pattern repeat naturally leads to the interpretation that Coupang's structural characteristic of reflecting external lowest price trends at regular intervals is at work.
In other words, when prices move first on external platforms:
Rocket Delivery prices either change at almost the same timing
Or follow with a short time lag.
For this very reason, you cannot identify the starting point if you only look at Coupang prices in isolation. To distinguish whether a change started inside Coupang or if Coupang followed a trend that had already begun externally, you absolutely need a structure that views price fluctuations across all platforms together.
When Was the Price Moved – Timing Changes the Flow
Price changes can occur multiple times a day. In particular, it is frequently observed that prices are adjusted surreptitiously during times when practitioners find it difficult to respond in real time, such as weekends or after working hours. For example:
Across the entire weekend period, when monitoring gaps are long
Late evening after working hours, when seller activity continues but practical response is difficult
Around midnight or early morning, when price changes are hard to notice
Once a price moves during these times, by the time it is checked the next day, the change has often already been reflected in the Rocket Delivery price. This makes it much harder to explain "when it started dropping" or "who moved first" if you only look at the price digits. Ultimately, timing itself becomes a factor that distorts the price flow.
In the end, the key question in Coupang price monitoring is not a simple check of the lowest price, but "Who moved first, where did it start, and at what time of day was it adjusted?" Understanding this flow is essential to finding the starting point of a price drop and detecting early risks of the brand's standard price being undermined.
Four Observation Points to Read 'Movements' in Coupang Prices
We previously discussed the importance of finding the starting point of price fluctuations. If so, how do prices actually move? In practice, looking at the following four points together allows for a clearer understanding of price flows.
(1) How Often Does the Price Change? — Change Cycle
Prices do not move at a constant rate every day. Some sellers maintain their prices for several days and then drop them significantly at a specific moment, while others adjust them multiple times within a single day. This change cycle itself creates a flow. Looking at "how often it moves" alongside the absolute value of the price more clearly reveals whether a seller focuses on one-off events or employs a repetitive operational method.
The change cycle is not just about frequency; it is also a metric that distinguishes the nature of selling methods. For example, a seller who keeps prices fixed for several days before making a large move usually has a promotion-focused operational flow, whereas a seller who changes prices multiple times a day often uses an immediate response method based on inventory levels or competitor pricing.
Additionally, sellers whose prices change too frequently are highly likely to affect Rocket Delivery prices or other sellers' prices. Therefore, the change cycle serves as practically meaningful information when explaining phenomena such as "why a price that once dropped is not going back up."
(2) What Time of Day Do Movements Cluster? — Time-Based Patterns
Even for the same seller, there are times when price adjustments concentrate around specific hours. In particular, as mentioned earlier, if adjustments are made when real-time response is difficult or during long monitoring gaps—such as weekends, after working hours, or early morning—prices may change multiple times within a short period.
Price adjustments during these times have often already caused chain-reaction changes in other sellers' or Rocket Delivery prices by the time they are checked the next day. Since these movements are not revealed by simple lowest price changes, looking at the time axis of "when the price changed" helps you understand the price flow much more clearly.
Moreover, "when the price dropped" is often linked to "who moved first," making the time of day one of the most practically important clues when determining price flows.
(3) Which Options Alone Are Moving? — Selective Adjustment Pattern
Even for the same product, prices may move differently depending on the option configuration. For instance, the main option price remains the same, but only a specific volume or package price drops. This movement helps read the operational flow, such as whether the seller intentionally adjusted the price of a specific option or temporarily applied a discount only to a configuration they want to promote.
Changes at the option level can create an illusion that "the overall price is stable because the main price remains unchanged." However, in reality, as specific options keep moving, it reveals directions such as which configuration the seller is focusing on or whether they are trying to clear out stock of a slow-moving option.
Furthermore, even if the main option price does not change, repeated fluctuations in sub-options can ultimately affect the overall price perception or Rocket Delivery prices, making it highly meaningful in practice to observe flows at the option level.
(4) Is the Interval of Price Fluctuations Consistent? — Repeating Rhythm
Some sellers move repeatedly at similar intervals when adjusting prices. For example, patterns may emerge where fluctuations occur daily or drop every 48 hours. While fluctuation intervals are not information from which intent can be definitively concluded, they serve as an important criterion for distinguishing whether a price change is a one-off or a repeating pattern.
Patterns that repeat at specific intervals show the seller's operational rhythm for adjusting prices. For example, a seller whose prices move every 24 hours is likely checking and adjusting for inventory changes or competitor prices daily, while a seller showing a 48–72 hour interval pattern suggests adjustments are being made according to a set schedule. Looking at this interval allows you to judge "whether this price drop is a coincidence or a continuation of an ongoing trend," and enables earlier detection of signs that the standard price is starting to drop.
In summary, while the first thing visible in price monitoring is the 'current lowest price', practically more useful information is what kind of movements took place to create that price.
Looking at the change cycle, time of day, option configuration, and repetition intervals together allows you to grasp price flows faster and detect signals of a Coupang Rocket Delivery price drop even earlier.
To Avoid Missing Coupang Price Drops – A 'Structure to Record Flows' is Needed
Once you have identified how prices have moved, only one question remains.
"Then, how can a practitioner manage this flow?"
As we have seen, prices:
Move differently for each seller
Show changes at different times on each platform
Can fluctuate multiple times within a single day
Therefore, it is difficult to manage the flow simply by checking "what today's lowest price is." Thus, the most important thing in practice is not losing the record of price changes—that is, "accumulating the flow."
Why It Is Difficult to Manage Price Flows – Gaps in Records
When practitioners monitor prices manually, the biggest difficulty is the gaps in price fluctuations.
For example:
If a price moved once in the early morning
But by the next morning, it has already changed again on another platform, shifting the flow
And no record remains of which seller touched which option first in the meantime
Then the basis for explaining "why it dropped like this" disappears. In other words, the reason you cannot follow the flow is not the price itself, but because 'the intermediate process is empty.'
When Records Accumulate, the Flow Becomes Visible – Log-Perspective Price Monitoring
Therefore, what is most needed in practice is a structure that records when, where, and who moved the price first.
This requires two axes:
The Time Axis (When did it move?)
: Prices do not just "drop once and end," but are often adjusted in stages at intervals of several hours. Since these price fluctuations frequently occur during times when it is difficult to respond—such as weekends or after working hours—having records organized chronologically ensures you do not lose track of the flow.
The Platform Axis (Where did it move first?)
: Looking at Coupang in isolation only shows the "result" of the price drop. It is difficult to verify which platform the price moved on first, whether a price drop on another platform affected Coupang, and if so, how to respond. You cannot explain the cause simply by looking at Coupang prices alone.
Unlike simple lowest price numbers, looking at these two axes together naturally helps you understand through what path the price moved to eventually impact the Rocket Delivery range.
How ReTrix Solves This Issue
We previously looked at why it is difficult to follow price flows. Now, what is needed is a structure that records that flow without missing anything.
ReTrix approaches this not by simply showing price flows as a 'current state', but by accumulating the entire history of changes without loss. To ensure practitioners can manage it without burden, it automatically builds up the price fluctuations of various platforms by time, and organizes them into a screen restructured around the seller, model, and standard price axes.
For example, on ReTrix's dashboard, you can read the flow from the following perspectives:
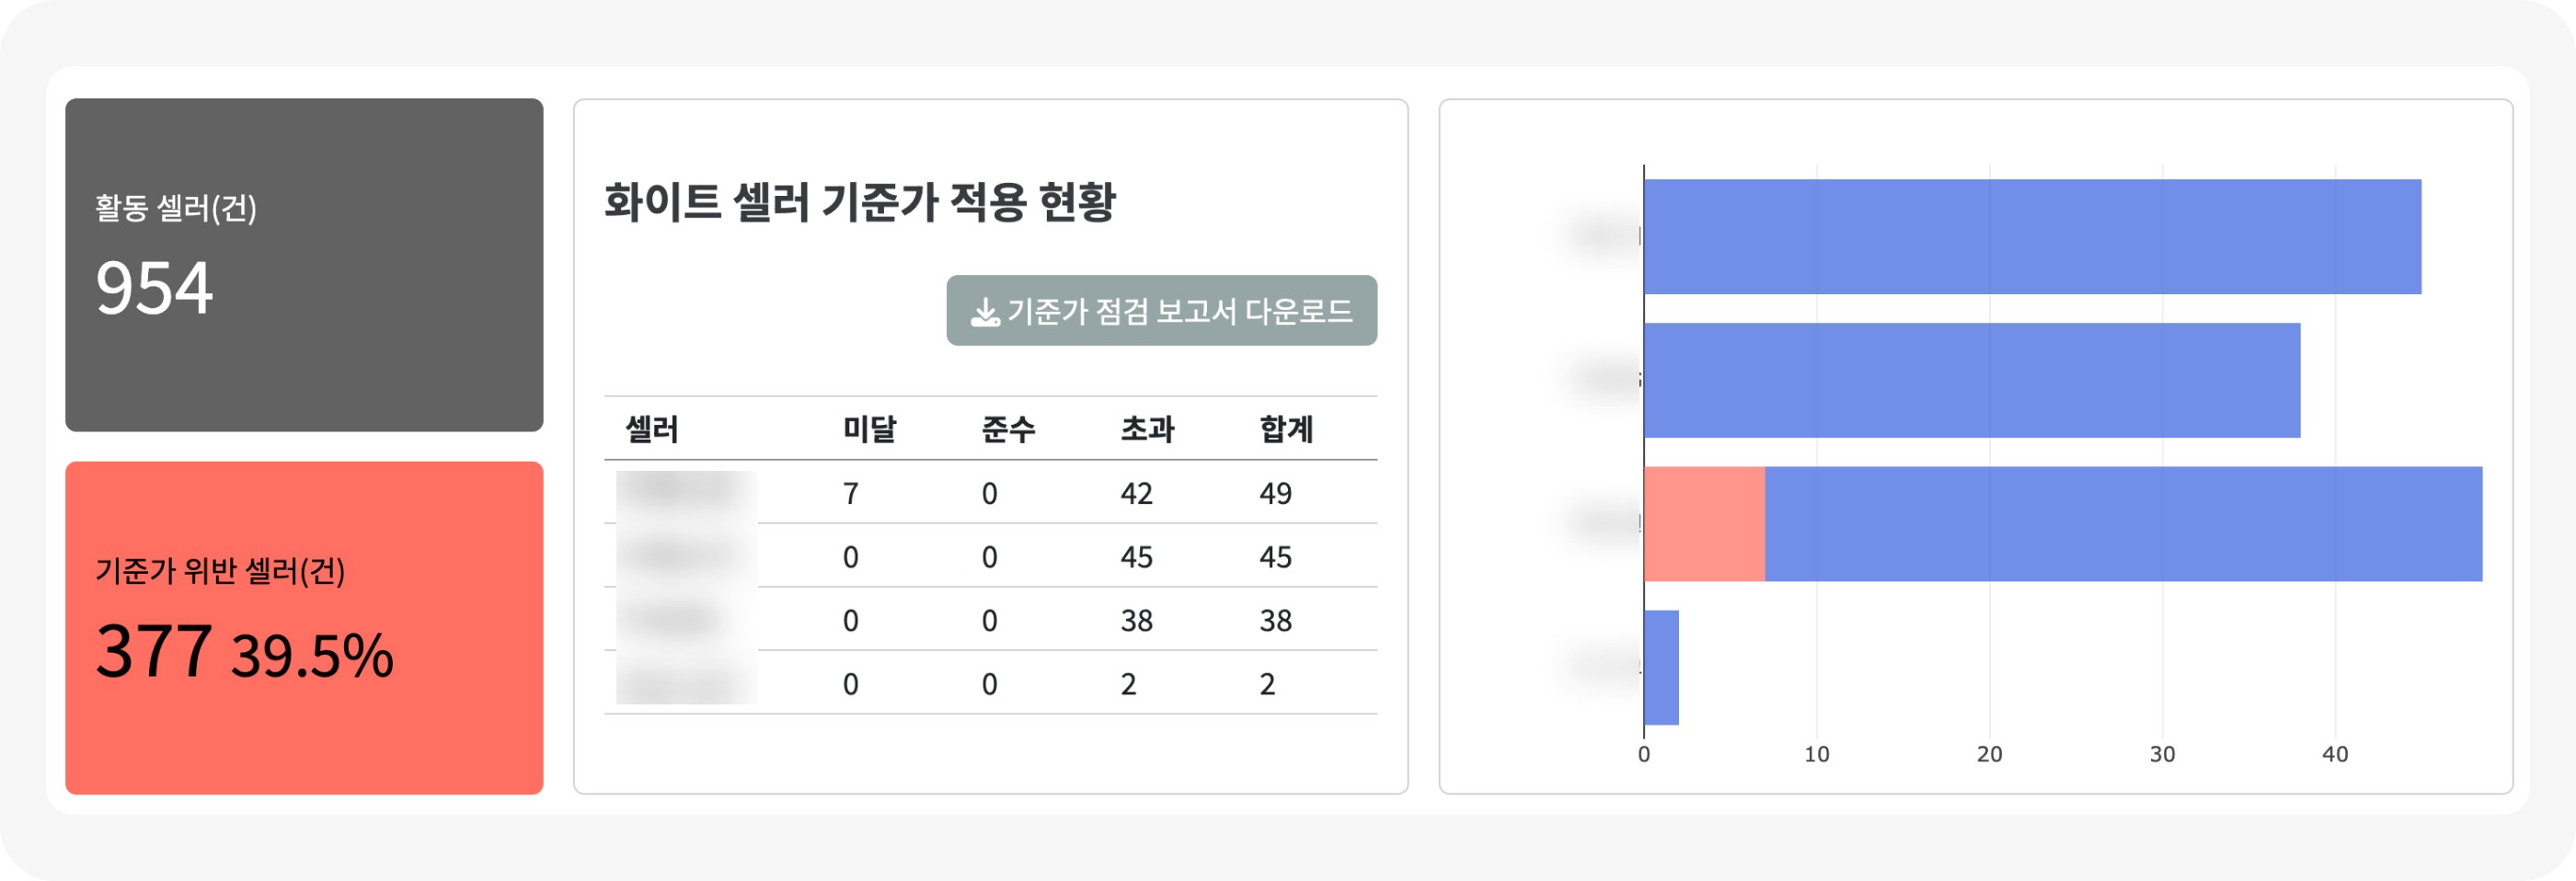
(1) Identify at a Glance Who Broke the Standard Price at the Seller Level
Based on active sellers, ReTrix automatically classifies and organizes them into:
Below Standard Price
Compliant with Standard Price
Above Standard Price
The biggest advantage of this structure is that you can check at once which seller has concentrated price risks. In particular, because the number of below-standard and above-standard cases per seller is visually organized, it is designed so that "which seller broke the standard first" is immediately revealed without the practitioner having to open pages one by one.
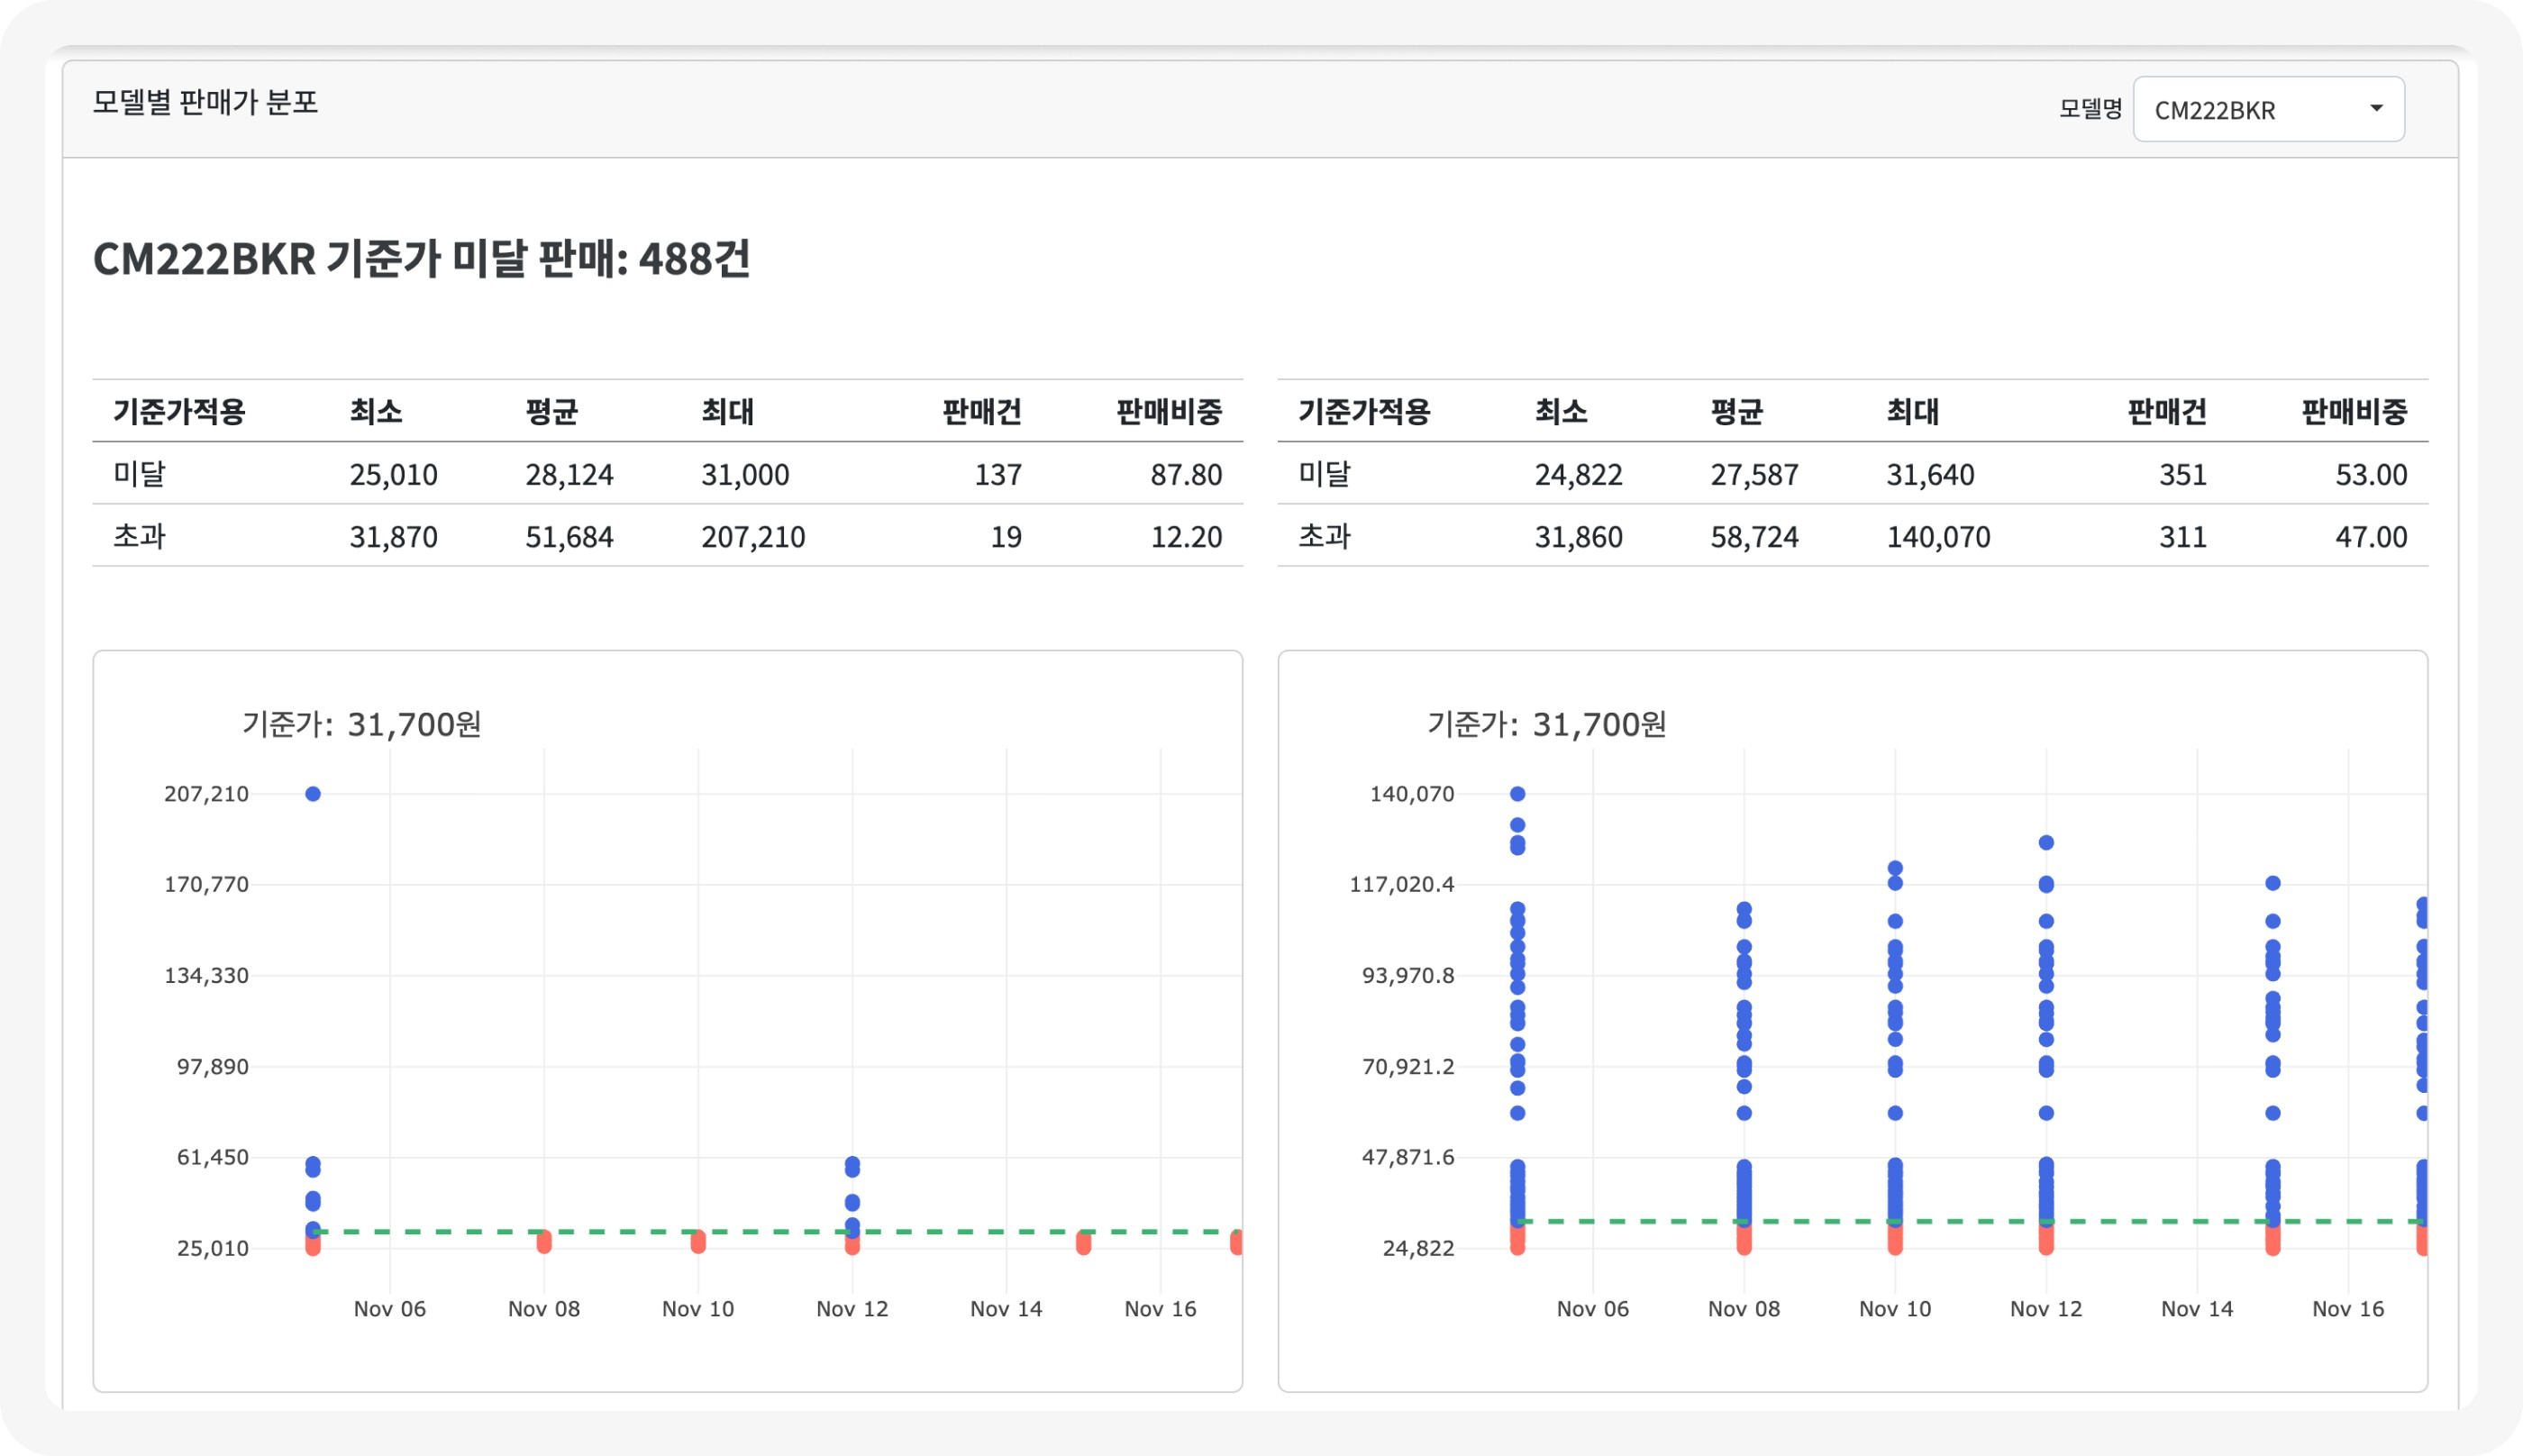
(2) Continuously Check Price Distribution by Model and Below-Standard Price Timing
Additionally, when looking at price changes based on models, the following information appears on the time axis in a scatter format:
Standard Price
Below-Standard Price Range
Above-Standard Price Range
This is a structure where the above three axes accumulate and appear in chronological order. The strength of this screen is that rather than simply showing "if it is below standard right now," it allows you to grasp from when the price started falling below the standard price as a flow unit. Because fluctuations that occur in intervals where real-time response is difficult—such as weekends, nights, and early mornings—are kept as logs, you will not miss "when the flow started."
Information that practitioners previously managed via screenshots, such as:
Prices at specific times of day
Changes before and after falling below standard
is automatically recorded, appearing as if the "flow" is connected by a line. This allows you to track the starting point of the price drop relatively quickly.
(3) Narrowing Down the Starting Point of the Flow While Viewing the Selling Structure by Platform
ReTrix does not just show the price of individual platforms, but organizes them so you can see the sales volume and below-standard price ratio across multiple platforms such as Naver, Danawa, and Coupang together.
This perspective is particularly useful in practice because:
It automatically records chronologically the price fluctuations that occurred across multiple platforms,
It narrows down the possibility that the Coupang price drop started on another platform first, and
By confirming patterns where price fluctuations on platforms concentrate on the same day or similar times, you can easily and simply track "which platform is the starting point."
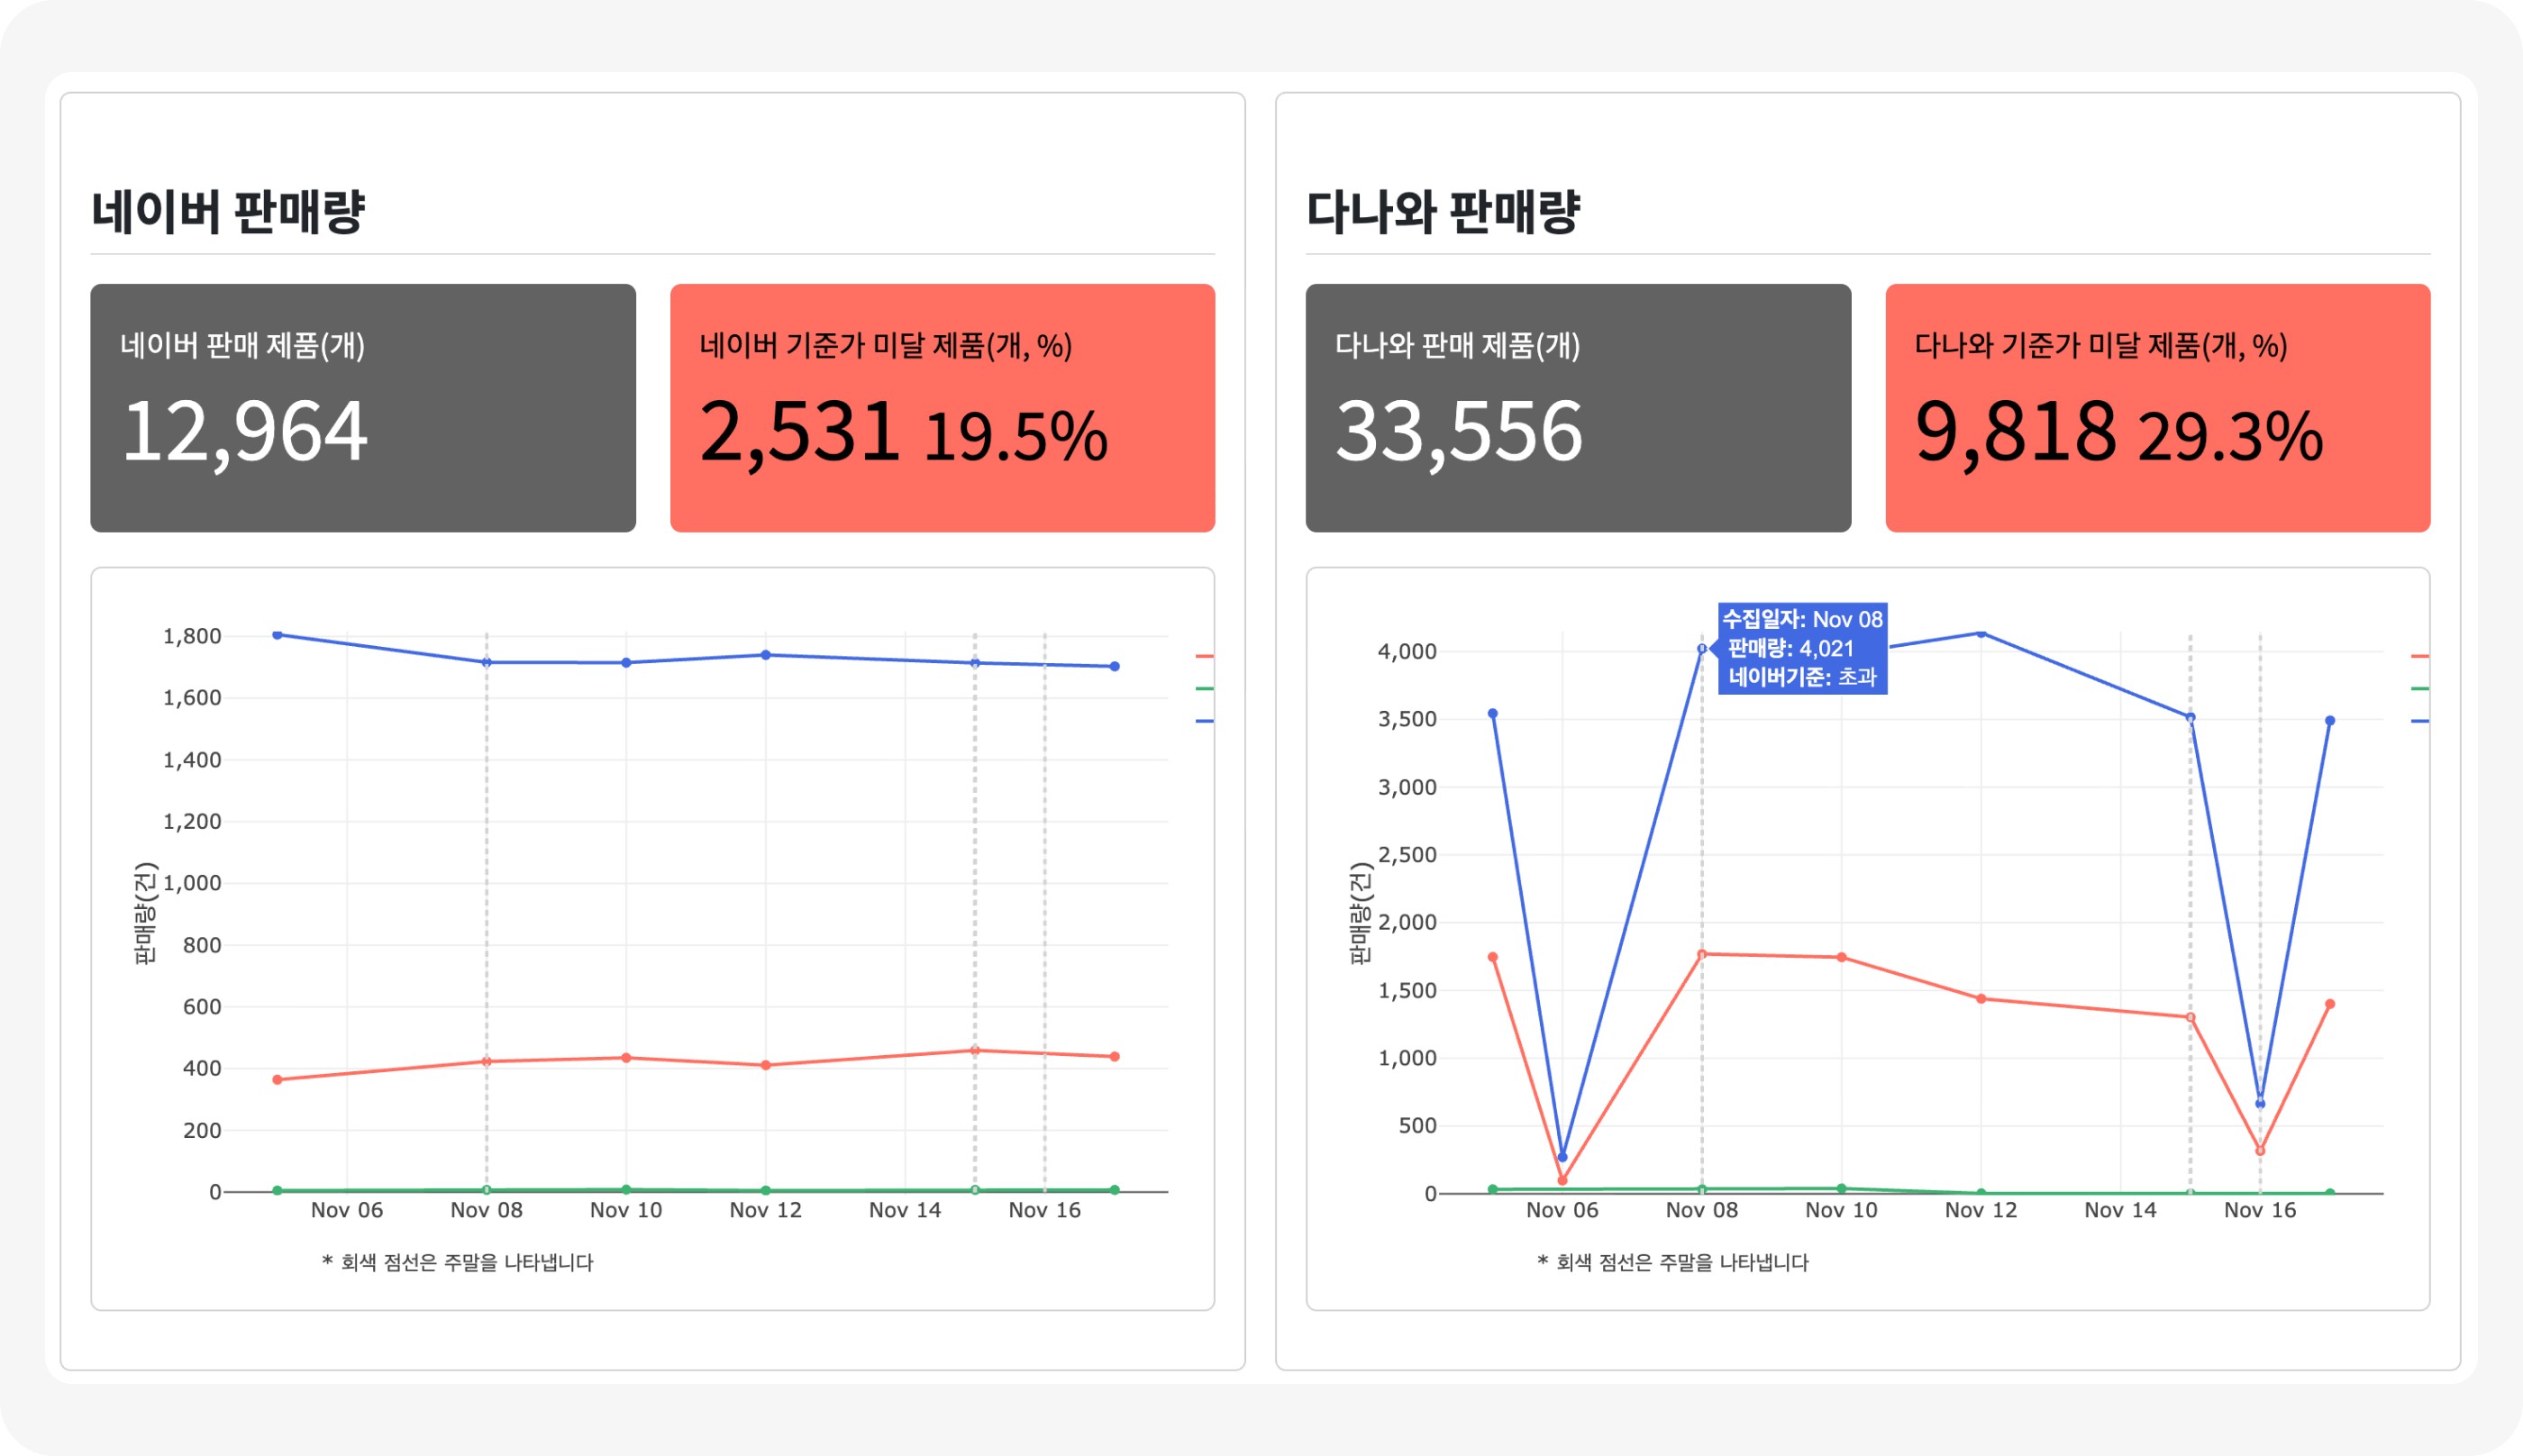
Because ReTrix automatically organizes this process into three layers—Seller, Model, and Platform—it provides it in a form where you can structurally understand price flows, rather than as a simple price snapshot.
Ultimately, practitioners do not need to refresh countless pages, open multiple platforms simultaneously, or capture and organize fluctuation timings one by one. Instead, they can handle the issue by quickly identifying only the starting point from within the already accumulated records.
The price movements discussed above manifest much faster and more diversely in actual fields. Therefore, trying to view prices as mere "numbers" causes you to miss a lot, but looking at them as a "recorded flow" makes the starting point of the problem clear. And when these records are automatically accumulated, practitioners can move past following the complexity of the flow and transition to a structure where they can quickly determine where the problem started.
Conclusion: Prices Must Be Read as Flows, Not Results
In conclusion, what matters in Coupang price monitoring is not "what today's lowest price is," but through what process that number was created. You need to see which seller, on which platform, and at what time of day touched the price first to understand more realistically how Coupang's Rocket Delivery standard price is being undermined.
It is not easy to follow this flow relying on memory alone every time. Screenshots and Excel spreadsheets make it difficult to capture all night and weekend fluctuations, meaning "when the problem started" quickly becomes blurred. Therefore, keeping prices as a record of movements across time and channels rather than as a single static number is closer to reducing the practical burden.
Ultimately, what practitioners must look after is not the result of the lowest price, but the flow that created that result. Because prices move several times a day and influence each other across multiple platforms, too many things remain invisible if you look at a single number in isolation.
Therefore, rather than viewing the price as a single fixed value, looking at it as a 'trail of changes' that follows time, channels, and sellers enables much more realistic judgments. And when these trails are consistently recorded and accumulated, brand practitioners can pinpoint exactly where the problem started without having to track complex processes one by one.