Image Theft
It seems obvious to the eye, so why was the report rejected? Proving image theft with numbers
💡 In this article, you can check the following contents.
“Isn't this plagiarism at this point?”
What is the Similarity Score?
Heatmap + Similarity Score: Evidence showing 'where' and 'how much' are identical
Practical examples: From internal reporting to platform reporting
Reetrix's proposal for Similarity Score utilization standards
Conclusion: Brand protection completed with figures and visualization
“Isn’t this outright theft?”
The most frustrating moment in brand protection is when you have an absolute gut feeling that 'they definitely ripped off our image,' yet the platform rejects your report. To the naked eye, it is glaringly obvious, but the platform always gives the same reason: “Insufficient evidence.” They dismiss the report based on minor differences, and as a result, unauthorized sellers continue their sales while only the brand suffers the losses.
Even if the engraving position or label spacing on the authentic image is clearly different, without objective figures or criteria to explain it, platform reviewers conclude that "the difference is not clear." No matter how much the manager emphasizes it, it is not accepted as "solid evidence." Ultimately, practitioners repeatedly find themselves with their hands tied, even when it is clearly theft.
At this point, what is needed is no longer 'intuition.' What is needed is a quantified standard that can show "why this image can be considered theft," namely, the Similarity Score. While the heatmap we looked at in the previous post showed 'where they are same and different,' this post deals with another weapon to be used alongside it: the standard to prove "how similar they are" with numbers.
What is a Similarity Score?
As mentioned earlier, the biggest obstacle practitioners face when preparing a report is the absence of a "language to explain it." When comparing the authentic image and the unauthorized image side by side, they look identical to anyone, but at the platform review stage, reports are not accepted based on subjective expressions alone. This is where the Similarity Score comes in.
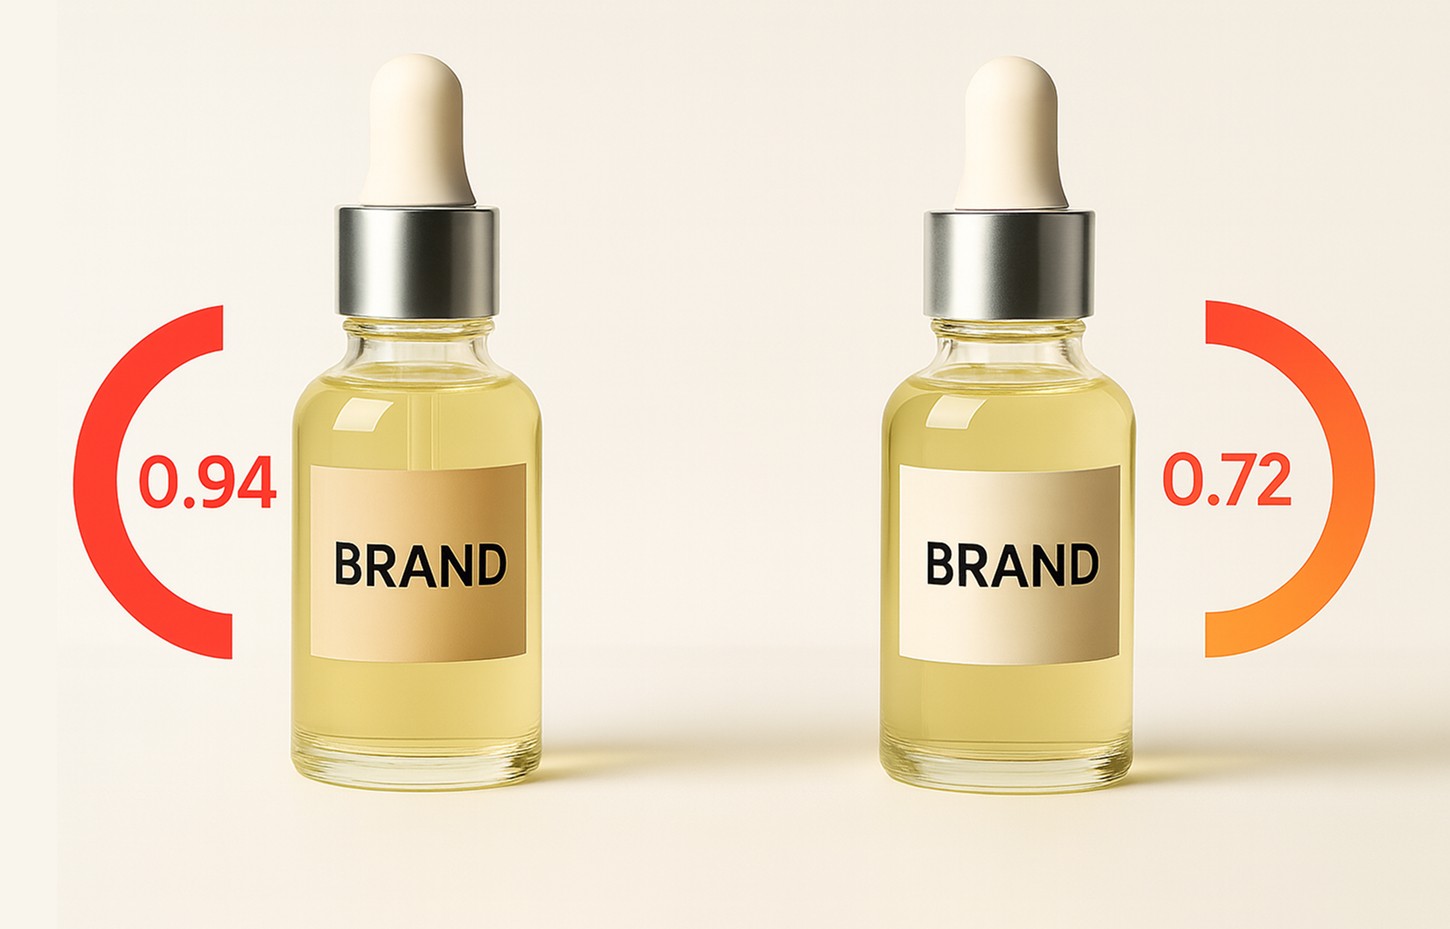
The Similarity Score is a value expressed between 0 and 1 after analyzing two images pixel by pixel and pattern by pattern. A value closer to 1 means the two images are highly similar, while a value closer to 0 means the similarity is low.
The reason this score is important is that it translates the practitioner's intuition into an objective language. Until now, we relied on vague expressions like "almost identical" or "similar," but now we can explain with a concrete number like "Similarity Score of 0.94." This makes discussions much clearer when reporting internally to supervisors or other departments, and significantly strengthens persuasiveness when reporting to platforms. In the actual industry, AI similarity scores are moving beyond simple technical indicators to become a data language that increases persuasiveness in internal reporting and legal action.
However, the similarity score alone cannot solve everything. The score shows "how similar they are," but it cannot explain specifically "where they are identical." That is why it becomes a powerful piece of evidence only when combined with the heatmap covered in our previous post. The similarity score provides quantitative criteria, while the heatmap handles qualitative explanation, forming a complementary relationship.
In other words, the Similarity Score is an objective yardstick that prevents practitioners from fighting with abstract expressions anymore. It is a new standard that allows us to communicate with objective numbers, rather than relying on "gut feelings." And for this score to hold meaning, it must be combined with the visual evidence of a heatmap to complete an evidence system that both the platform and internal stakeholders can accept. We will explain these two metrics in more detail next.
Heatmap + Similarity Score: Evidence showing ‘where’ and ‘how much’ they are similar
Similarity Score and Heatmap use different languages to determine image similarity. The Similarity Score converts the ratio of “how similar they are” into a number between 0 and 1, while the Heatmap expresses “where they are identical, and where they differ” through color distribution. When both elements are present together, practitioners can establish a much stronger evidence system. With only the score, a quantitative explanation of 'high/low' is possible, but it is difficult to explain exactly which parts are identical or where the differences occurred. Conversely, while a heatmap alone can show visual differences, it is difficult to back up with figures how meaningful that difference is overall.
As explained earlier, the Similarity Score is an index that averages the degree of match of the entire image. A score of 0.95 can be evaluated as almost identical, while 0.75 shows that there is a meaningful difference. Because it is summarized in a single number, it is intuitive and quick to understand, but it does not tell you where the differences lie.
On the other hand, a Heatmap reveals the specific locations of differences. Similar areas are shown in blue tones, while differences are displayed in yellow, orange, and red. Since detailed elements such as product bottle shape, label position, and package texture are revealed through color, the fact that "a difference exists" can be visually verified. However, from the heatmap alone, it is difficult to know how significant that difference is in relation to the entire image.
As such, while a similarity score alone allows for a quantitative explanation of 'high/low,' it is difficult to explain exactly which parts are identical and where the differences lie. Conversely, while a heatmap alone can show visual differences, it is difficult to support with numbers how meaningful that difference is overall.
Therefore, placing both results together makes the interpretation much clearer. The structure is such that the similarity score summarizes the overall similarity numerically, and the heatmap visually demonstrates where that number comes from. In other words, the Similarity Score acts as a summary language showing overall match, while the Heatmap serves as an explanatory language indicating the location of localized differences.

Practical Use Cases: From Internal Reporting to Platform Takedown
Let's look at how the Similarity Score and Heatmap explained above can be applied to actual situations in practice. The recurring obstacle in the field is the question, "It looks clearly stolen, but how do we prove it?" By presenting the Similarity Score and Heatmap together in this process, reports that would have been rejected in the past gain much more persuasiveness for the same image.
First is the platform reporting stage. Let's assume a seller has reused an authentic image, changing only the background. On the heatmap, the product body is stably displayed in blue, while only the background area appears red. If the similarity score is 0.92 at this time, it is possible to present an objective figure showing that "the core product elements are identical, and only the background is different." Submitting analysis data to the platform stating, "Similarity Score 0.92, Heatmap results show difference only in background, label and container are identical," is far more persuasive than a subjective claim of "it's similar." Materials combining numerical and visual evidence are easy for platform review managers to understand, reducing unnecessary rejections.
Second is the internal reporting process. Within a brand, debates often arise over whether "it is theft or not." However, presenting data based on similarity scores and heatmaps can resolve this. For example, if it is an image with some components removed or composited, the corresponding area will be marked in red on the heatmap, and the similarity score will drop to the 0.70s. This quantified explanation of "the product composition itself is different" reduces subjective differences in judgment among managers and allows for quick alignment. This speeds up decision-making, minimizing brand damage caused by delayed responses.
Third is tracking repeat offending sellers. When the same seller registers modified images multiple times, you can check whether they are 'reusing the same pattern' based on the similarity score range. For instance, if scores of 0.92 to 0.95 are repeatedly generated, this serves as strong evidence that they are continuously utilizing the same original source. In this process, the heatmap can provide additional explanation as to where each variation occurred, which can be used to document and analyze the seller's patterns.
In this way, the Similarity Score and Heatmap go beyond simply saying 'similar/different' to function as practical evidence at all stages of reporting, takedowns, and tracking. Thanks to this, brands can make data-driven decisions and reduce unnecessary drain in the response process.
Reatrics' Proposed Standards for Using Similarity Scores
A Similarity Score is not just a simple number; it holds meaning when used as a baseline for practitioners to make decisions. In the industry, a score of 0.9 or higher is generally interpreted as strong similarity. For example, if the score is between 0.33 and 0.95, it is sufficient to use as evidence that the core product image is identical, even if surrounding elements like background or size have changed.
However, this score alone does not determine the success or failure of a report. The Similarity Score is merely a quantitative indicator showing “how similar they are overall,” and is not an absolute standard that guarantees a successful report in itself. For example, even with a score in the 0.7 range, a report can be established if similarity is confirmed in core elements of the product (logo, label, container, etc.). Conversely, even if the score is high (e.g., 0.9 or higher), if the area where the difference occurs is at the core of the brand asset, a high score alone cannot guarantee a successful report.
Generally, the 0.7 range is a pattern seen in modified theft where components are partially removed or composited, which can be seen as the stage where product identity begins to waver. In this case, you must present the heatmap together to explain in which parts the modifications occurred to increase persuasiveness. A score of 0.6 or lower may look visually similar, but because the quantitative similarity is insufficient, it is unlikely to convince platforms or third parties, and practically, it is efficient to classify this as a "pending" or "additional evidence gathering" stage.
Therefore, what is important is not simply cutting off scores as 'reportable/unreportable,' but considering the score + Heatmap + context (product composition, label, etc.) together. Interpreting both results together increases the persuasiveness of the report's evidence, allowing practitioners to set priorities without wasting time.
The Reatrics AI Image Similarity Diagnosis Service proposes these criteria for each range, helping practitioners present data-driven evidence in both internal reports and platform takedowns. Instead of just showing a score, it combines the Score and Heatmap to clearly distinguish between "reportable levels" and "levels requiring additional review." Once this standard is established, it reduces rejected reports and allows practitioners to explain "why this case must be pursued aggressively" with numerical and visual evidence during internal reporting.

Conclusion: Brand Protection Completed through Numbers and Visualization
As we have seen in this post, it is difficult for a report to be successfully accepted based solely on the subjective claim that "it looks like theft." However, by utilizing the quantitative standards presented by the Similarity Score along with the visual evidence shown by the Heatmap, practitioners no longer have to rely on vague certainties. Reports that used to be rejected gain persuasiveness, rapid consensus becomes possible during internal reporting, and the basis for tracking repeat offending sellers becomes much clearer.
Ultimately, the success of brand protection depends on whether you can transition from 'intuition' to 'data.' The similarity score and heatmap are the most concrete tools to apply this transition to actual practice. Now, what is important is establishing these two as a work routine rather than a one-off analysis. By doing so, brands can build a system to protect their credibility, unshaken by the clever image modifications of unauthorized sellers.
In the future, rather than the feeling of "it looks similar," a data-driven explanation of "Score 0.94, Heatmap identical" can become the core competitiveness that protects a brand's value. Beyond simply increasing the success rate of reports, this will be the most persuasive weapon for a brand to make its voice heard in the market and on platforms.