Price Management
"50 violations detected".. If the monthly monitoring report doesn't have 'this', you are wasting your money
💡 In this article, you can check the following content.
The number of reports has increased, so why don't we feel confident that we have swept the entire market?
The trap of '50 cases detected, 80% processing rate': What is missing in the reports we receive every month
The 3 steps a brand actually needs to know: Collection → Reporting → Results
Data that becomes an asset 1 year later vs. Reports that just become past records
The real question to ask instead of "How many cases did we process this month?"
The number of reports has increased, so why doesn't it feel like we've swept the entire market?
If you are a manager using a distribution monitoring solution, you probably receive a similar report every month. It compiles figures showing how many violating sellers were detected and how many sales suspensions were processed this month. The numbers have certainly increased compared to last month, and actions have been taken successfully. However, even after reading the entire report, you might still feel somewhat unsettled. "Is this all? Have we really swept the entire market?"
This unsettled feeling is by no means due to the manager's excessive worry. It stems from a structural problem in the way data is delivered. For example, if the number of detections is 50, it is difficult to determine from the report alone whether this figure is the result of catching most of the total violations or just the tip of the iceberg. If it's 50 out of 100 cases, you've caught half, but if it's 50 out of 500 cases, you've missed 90%. In a structure where you only receive the final figures, both appear as the exact same "50 cases" without any way to distinguish between the two.
What you missed does not appear in the final report. Only what was caught remains as a number, and areas that were not collected in the first place are not recorded anywhere in the report. Without knowing how much was collected, the situation of not knowing how much was missed repeats itself.
Therefore, in this article, we would like to look at what kind of difference it makes in practice between the method of only receiving reports on results and the method of directly looking into the entire process from collection to results, one by one.
The Trap of '50 Detections, 80% Processing Rate': What is Missing from Our Monthly Reports
Most distribution monitoring reports are structured around 'outcome metrics.' The core consists of figures such as how many violating sellers were detected during this period, how many of them were processed with sales suspensions or post takedowns, and how many sellers were re-detected. Since it comes in neatly organized tables and graphs, it is a convenient way to grasp at a glance, "We processed this much during this period."
This does not mean that these outcome metrics are meaningless. The number of actions and the processing rate are clear proof that the solution is actually working, and they are also used intuitively when reporting performance to management. However, there remains one question that cannot be answered with these figures alone: "How much of the total market does this number represent?"
As mentioned earlier, whether the figure of 50 detections is a meaningful achievement or not can only be judged when you know the denominator. If there were 60 suspected violations in the market, you have caught most of them; if there were 600, you have only processed one-tenth. Outcome metrics (number of processed cases, number of caught sellers) correspond to the numerator among these. For this numerator to be meaningful, the denominator—that is, 'how much of the total was collected and reviewed'—must be shown together. However, many reports emphasize only the numerator and omit the denominator. A figure without a denominator looks like an absolute value, but in reality, it is an ambiguous number with a very wide range of interpretations.
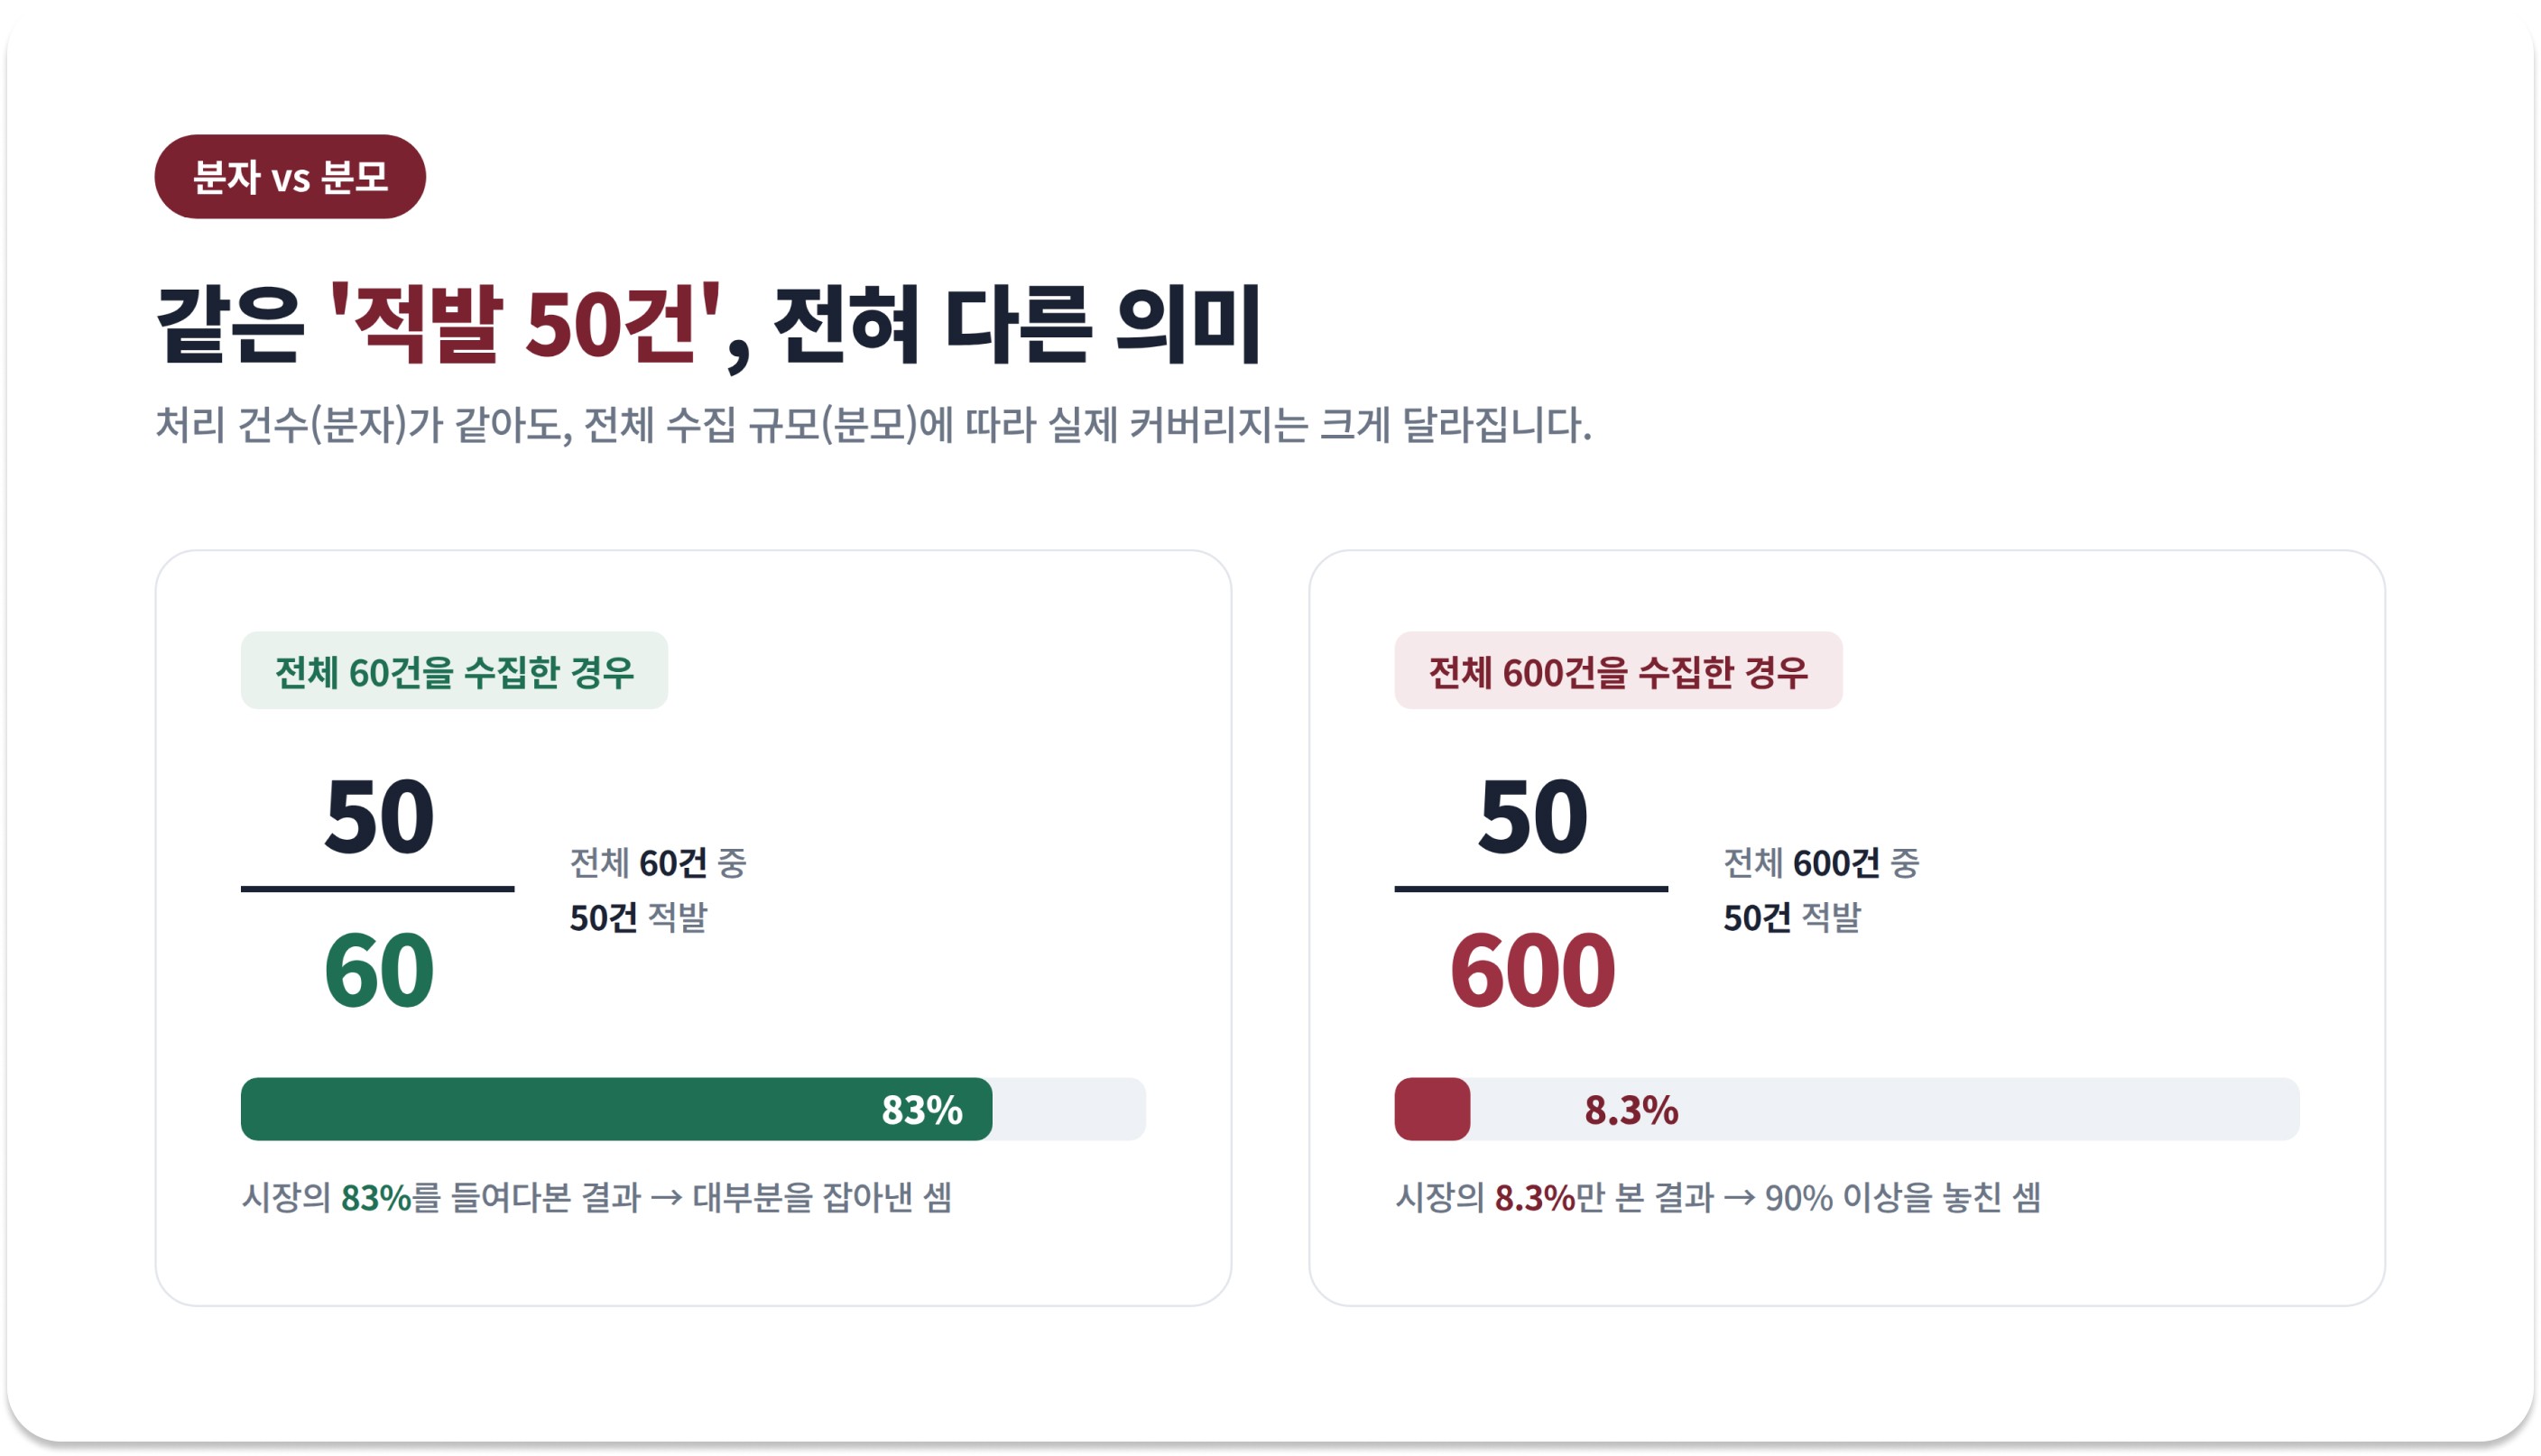
Without a denominator, the same number is read differently
If the denominator is not visible, misinterpreting the situation in practice often occurs. For example, let's say the number of detections this period has decreased compared to last time. A brand manager usually interprets this in one of two ways: either the market has stabilized and violations have actually decreased, or the collection scope has narrowed and fewer were filtered out. However, you cannot distinguish between these two based on the outcome figures alone. Even though detections decreased because the collection scope narrowed, one might judge that the situation has improved simply by looking at the numbers and miss the timing to respond. The same goes for when detections increase. Without a denominator, it is impossible to know whether violations actually increased or if more data was simply collected during that period.
Outcome metrics show 'what was processed,' but they fail to show 'what was not processed,' and furthermore, 'what was not even seen in the first place.' Even if an 80% processing rate looks reassuring, if that 80% is achieved while collecting only 20% of the entire market, the actual market coverage is a mere 16%. If a manager only receives the final results without knowing the collection scope, they cannot understand the real status of how their brand's products are being misused or abused online. Even while spending money on a solution, they end up not knowing the most important thing: the 'real state of our market.'
The 3 Stages a Brand Actually Needs to Know: Collection → Reporting → Result
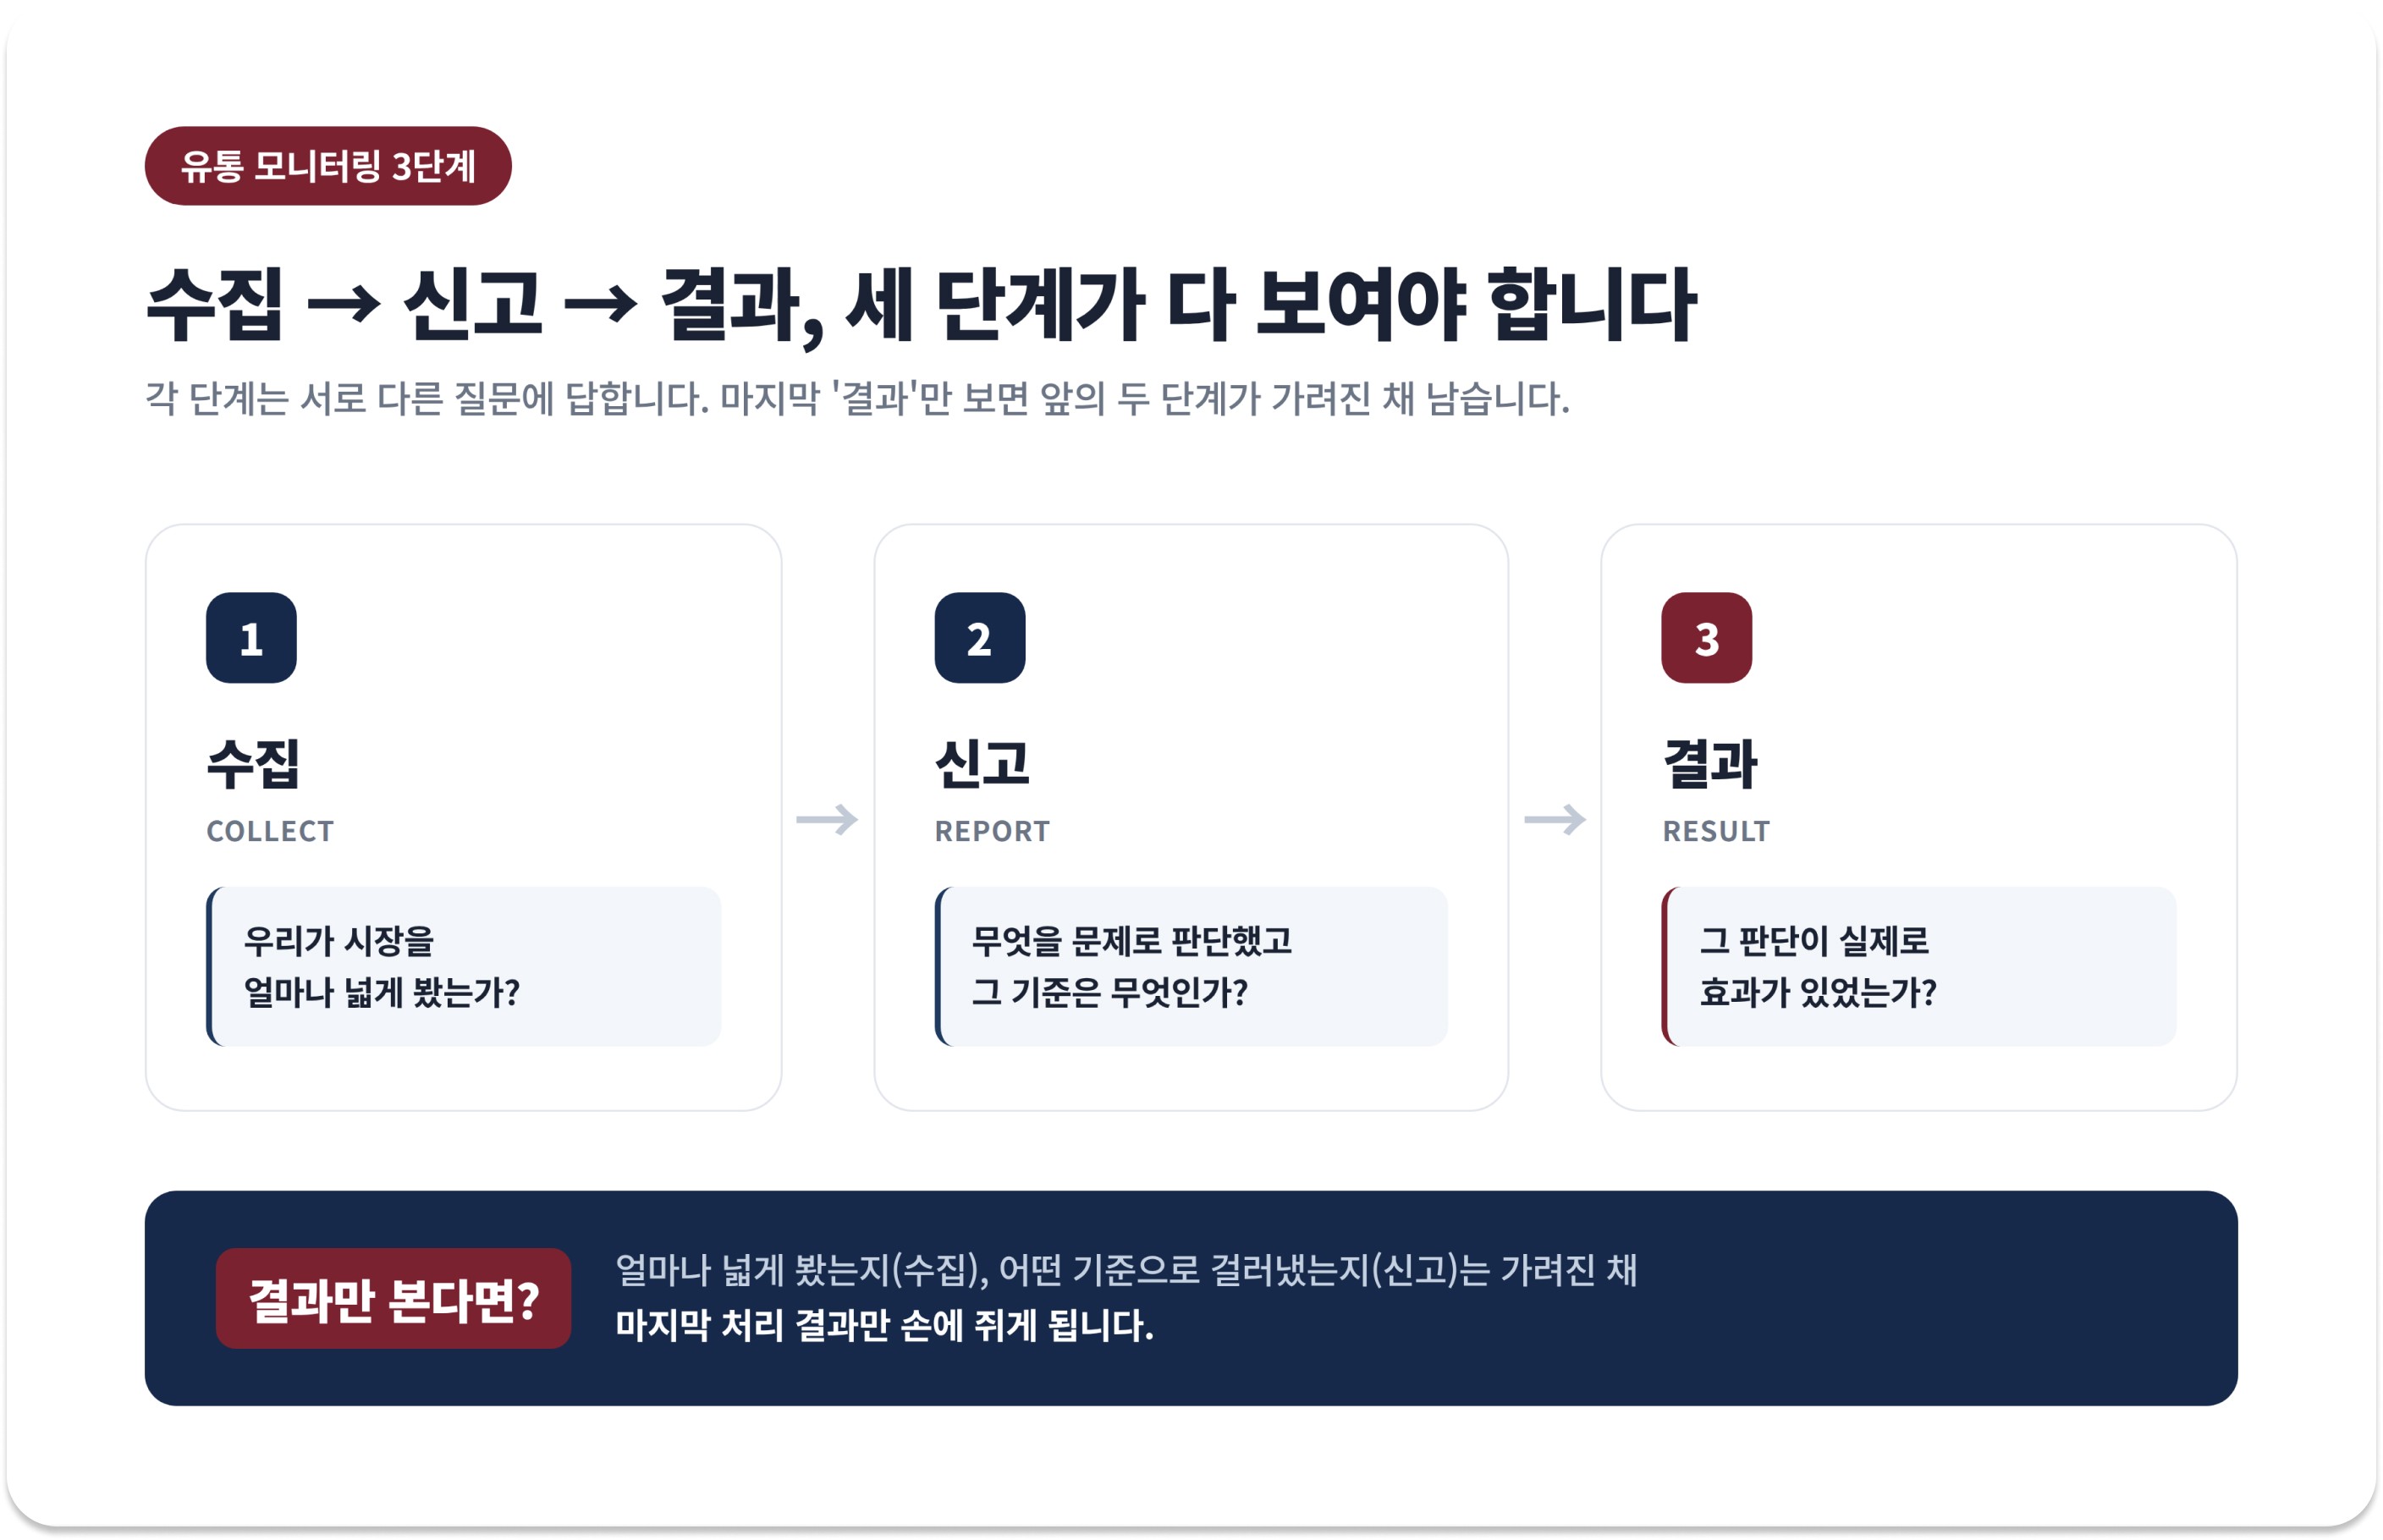
Then, what needs to be visible to judge what state our market is currently in? Distribution monitoring is broadly divided into three stages: How much of the inventory on the market was gathered (Collection), which of those were judged as violations based on what criteria and reported (Reporting), and what actual actions those reports led to (Result). The outcome metrics discussed earlier correspond to the last of these stages.
Each of the three stages answers a different question. Collection shows 'how widely we looked at the market,' Reporting shows 'what was judged as a problem and what the criteria were,' and Result shows 'whether that judgment was actually effective.' Only when these three are visible together can we finally answer the question, "How is our market currently running?" However, in a structure where you only receive results, the first two stages remain hidden. You end up with only the final processing results in hand without knowing how widely you looked or by what criteria you filtered them.
The collection stage is particularly important because the scale of this stage fundamentally changes depending on whether it is done manually or automated. No matter how diligently a manager moves to search and verify manually, looking into a few hundred cases in a single period is a realistic limit. The manual monitoring methods covered in the previous post (price snapshots, regular inspection routines, etc.) work well enough in the early stages, but there is a clear limit to the amount of data that can be swept by human hands.
On the other hand, automated collection gathers tens of thousands of cases during the same period. The difference between hundreds and tens of thousands goes beyond merely the size of the numbers and leads to a difference in how the market is viewed. Looking at hundreds of cases is close to sampling, extracting a portion of the market as a sample, while sweeping tens of thousands of cases is close to a complete enumeration survey.
This difference in approach directly translates to the reliability of data judgment. In a sampling approach, areas that happen not to be caught in the sample remain as blind spots. Sellers who lower prices only during nights or weekends, or listings exposed only at specific times, can be missed entirely depending on the sampling point. On the other hand, if you collect data close to a complete enumeration, when the number of detections decreases, you can verify through the denominator whether it is because violations actually decreased or because data collection was missed. The 'problem of not knowing the denominator' pointed out earlier is determined by this collection scale. Even if the final result is the same 50 cases, the meaning of that number is completely different depending on whether there is a sample of hundreds or a complete enumeration of tens of thousands behind it.
Data That Becomes an Asset After 1 Year vs. Reports That Just Become Past Records
Just because the collection scale is sufficient does not mean it is over. Depending on the form in which the brand holds the collected data, the same monitoring can have completely different values. What differs here is the difference between a structure of 'receiving reports' and a structure of 'owning' data.
In a 'reporting structure,' the solution handles both collection and judgment and then delivers only the summarized results to the brand. It is neat, but the raw data before those results came out remains with the solution, and only summaries accumulate on the brand's side. On the other hand, in an 'owning structure,' the brand can directly look into and download the entire collected listing data—that is, the raw data of which seller listed what, when, and at what price. Although both may look similar for now, as time accumulates, the gap becomes clear.
The moments when data becomes a brand asset usually occur in three situations. First is understanding seller patterns. When 6 months or 1 year of data accumulates, patterns begin to appear, such as which specific seller repeatedly raises violating prices at what point, or which seller reappears under a different name after an action is taken. It is difficult to trace this time-series flow with summary reports alone. Second is reporting to management. The persuasiveness of the report changes when you can show "how much the average violating price has decreased over the past year and how the top violating sellers have changed" rather than "processed 50 cases this month." Third is responding to issues. When prices suddenly collapse or a dispute arises, there is a difference in response speed between a brand that can immediately pull up past data and a brand that has to request materials from the solution provider.
3 Questions to Ask Your Current Solution: Are you reporting, or do you own?
Then, how can you check which structure the solution you are currently using or reviewing belongs to? Without getting complicated, you can quickly assess with three questions.
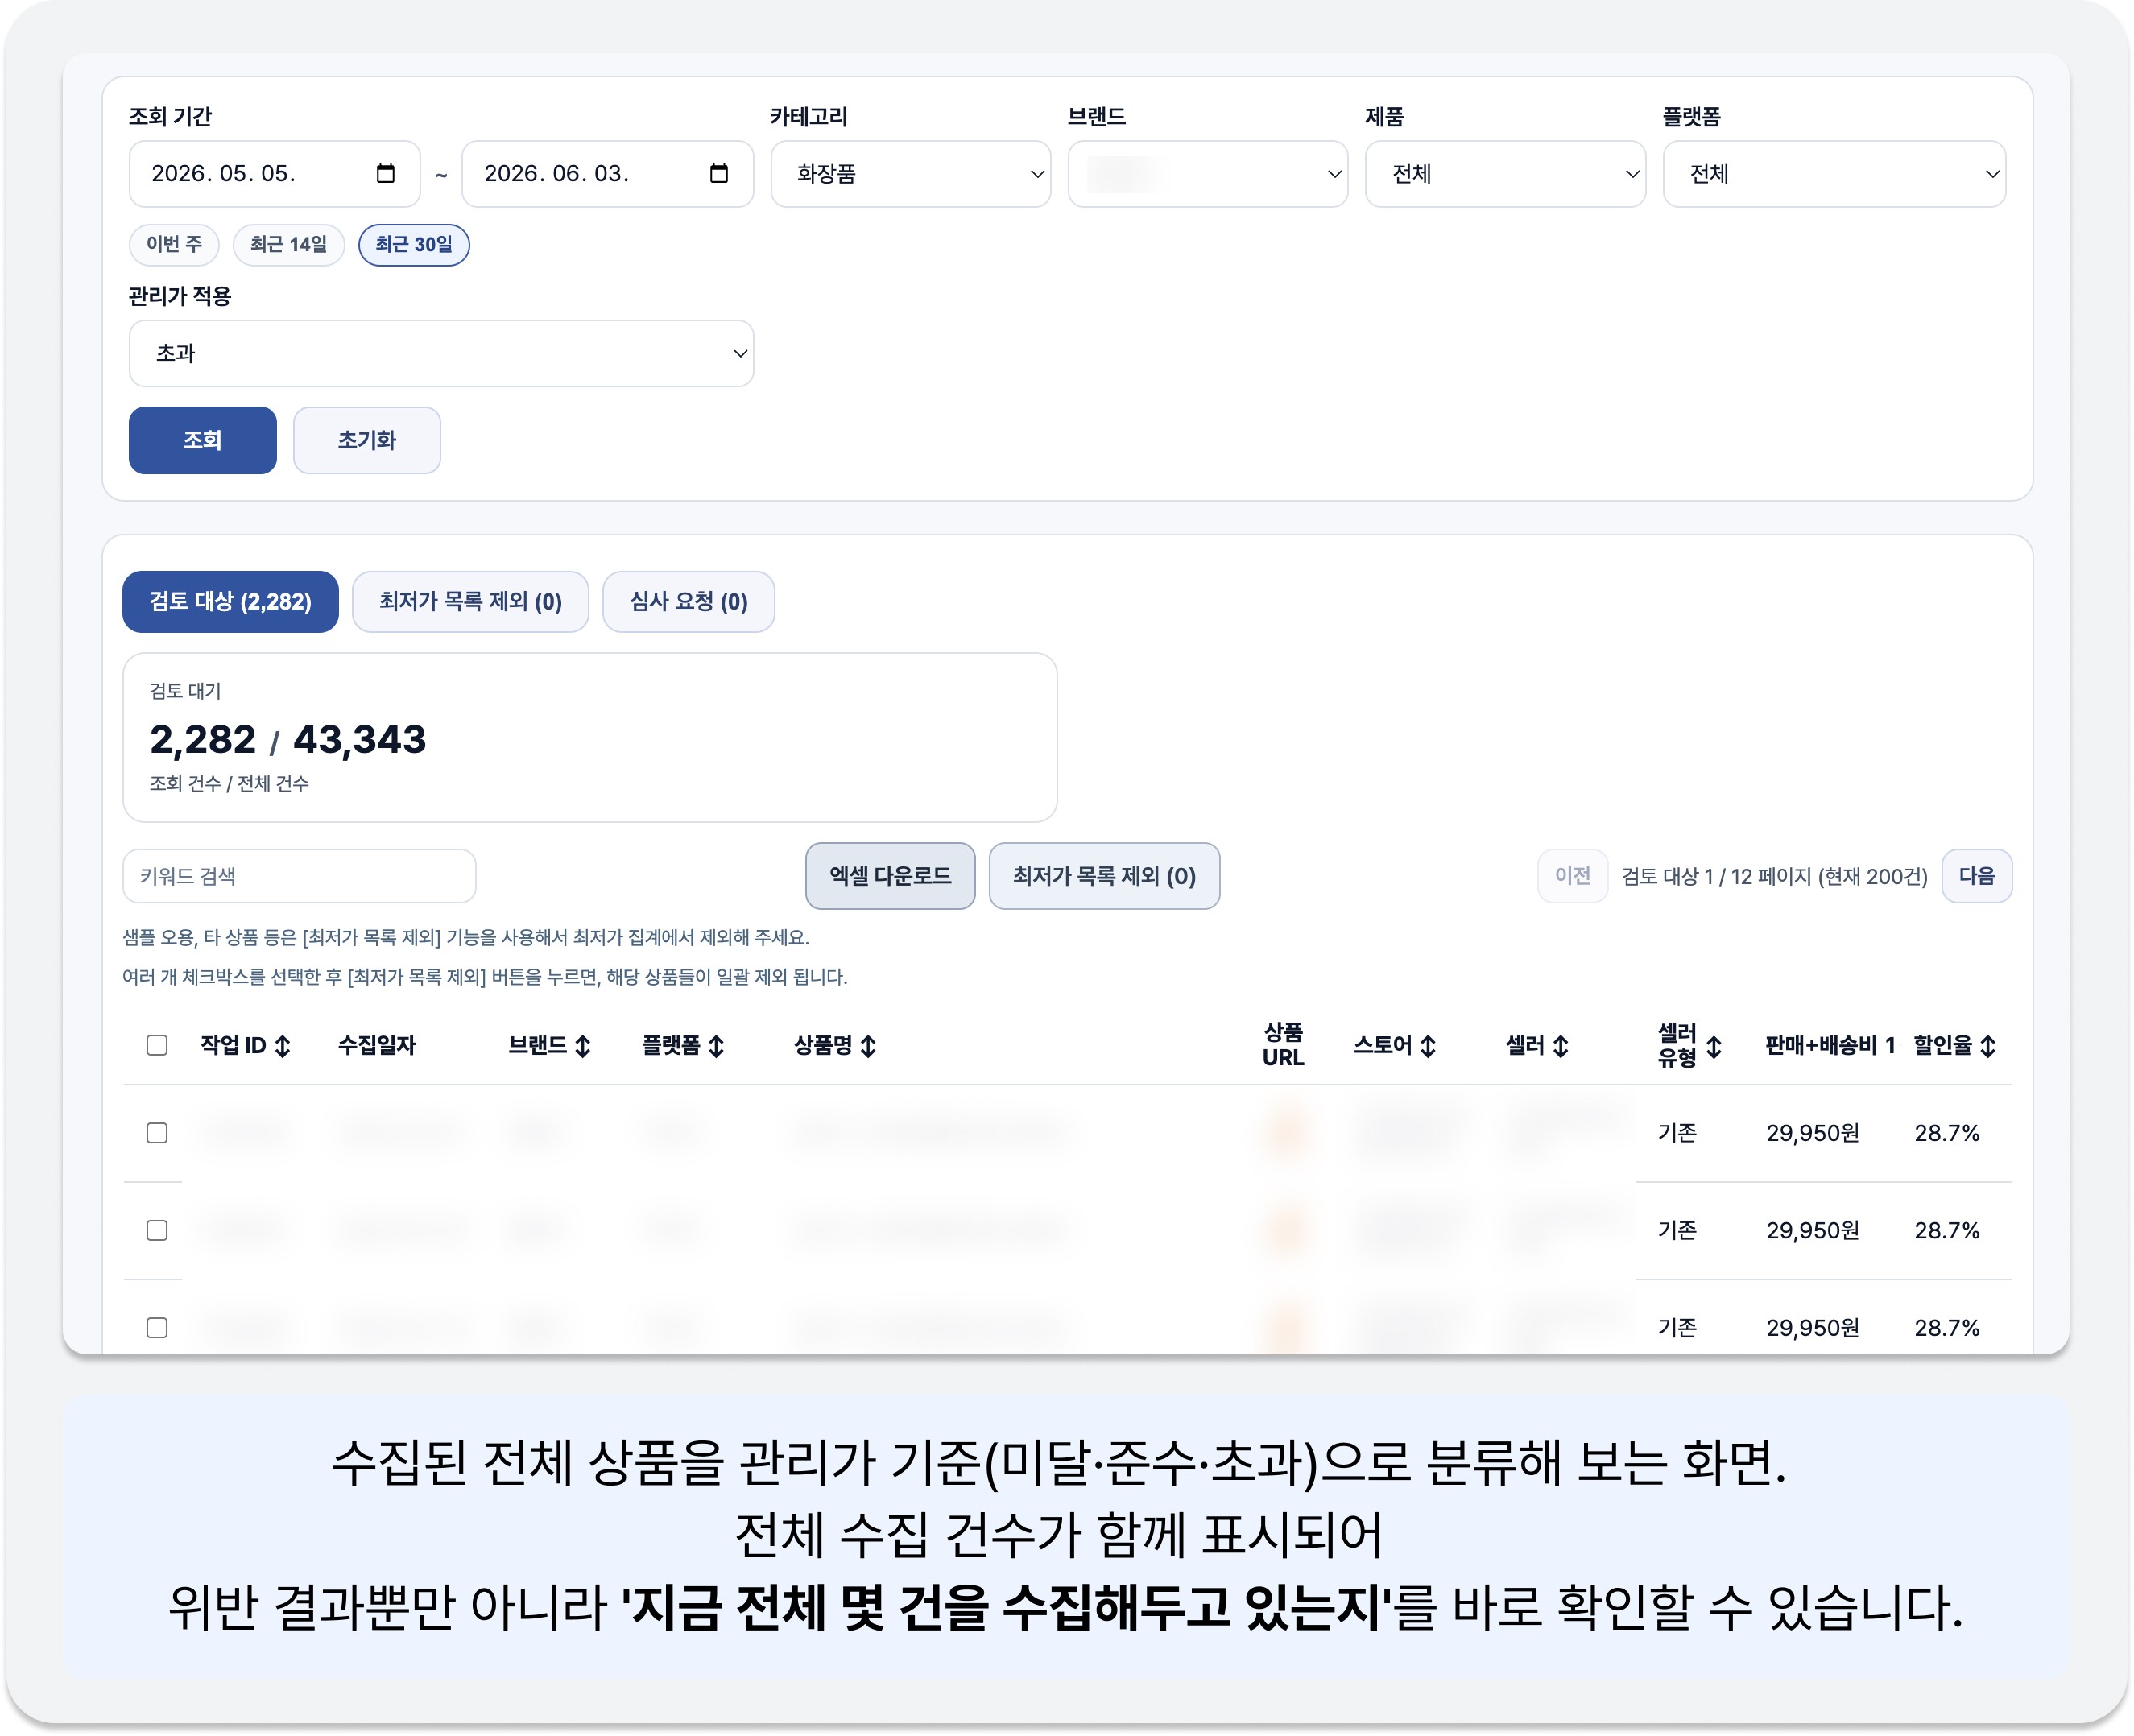
1️⃣ First, "Can I check right now how many cases were collected this month?"
You can see whether it is queried directly on the dashboard or if you have to request a report from the manager. If the collection scale is visible in real-time, it is a structure where the denominator is open.
2️⃣ Second, "What are the criteria for being classified as a risky seller?"
This is a question to clearly understand on what basis the targets for reporting were determined. Only when the judgment criteria are transparently shared can the reporting stage avoid being vaguely hidden, allowing the concrete process to be verified.
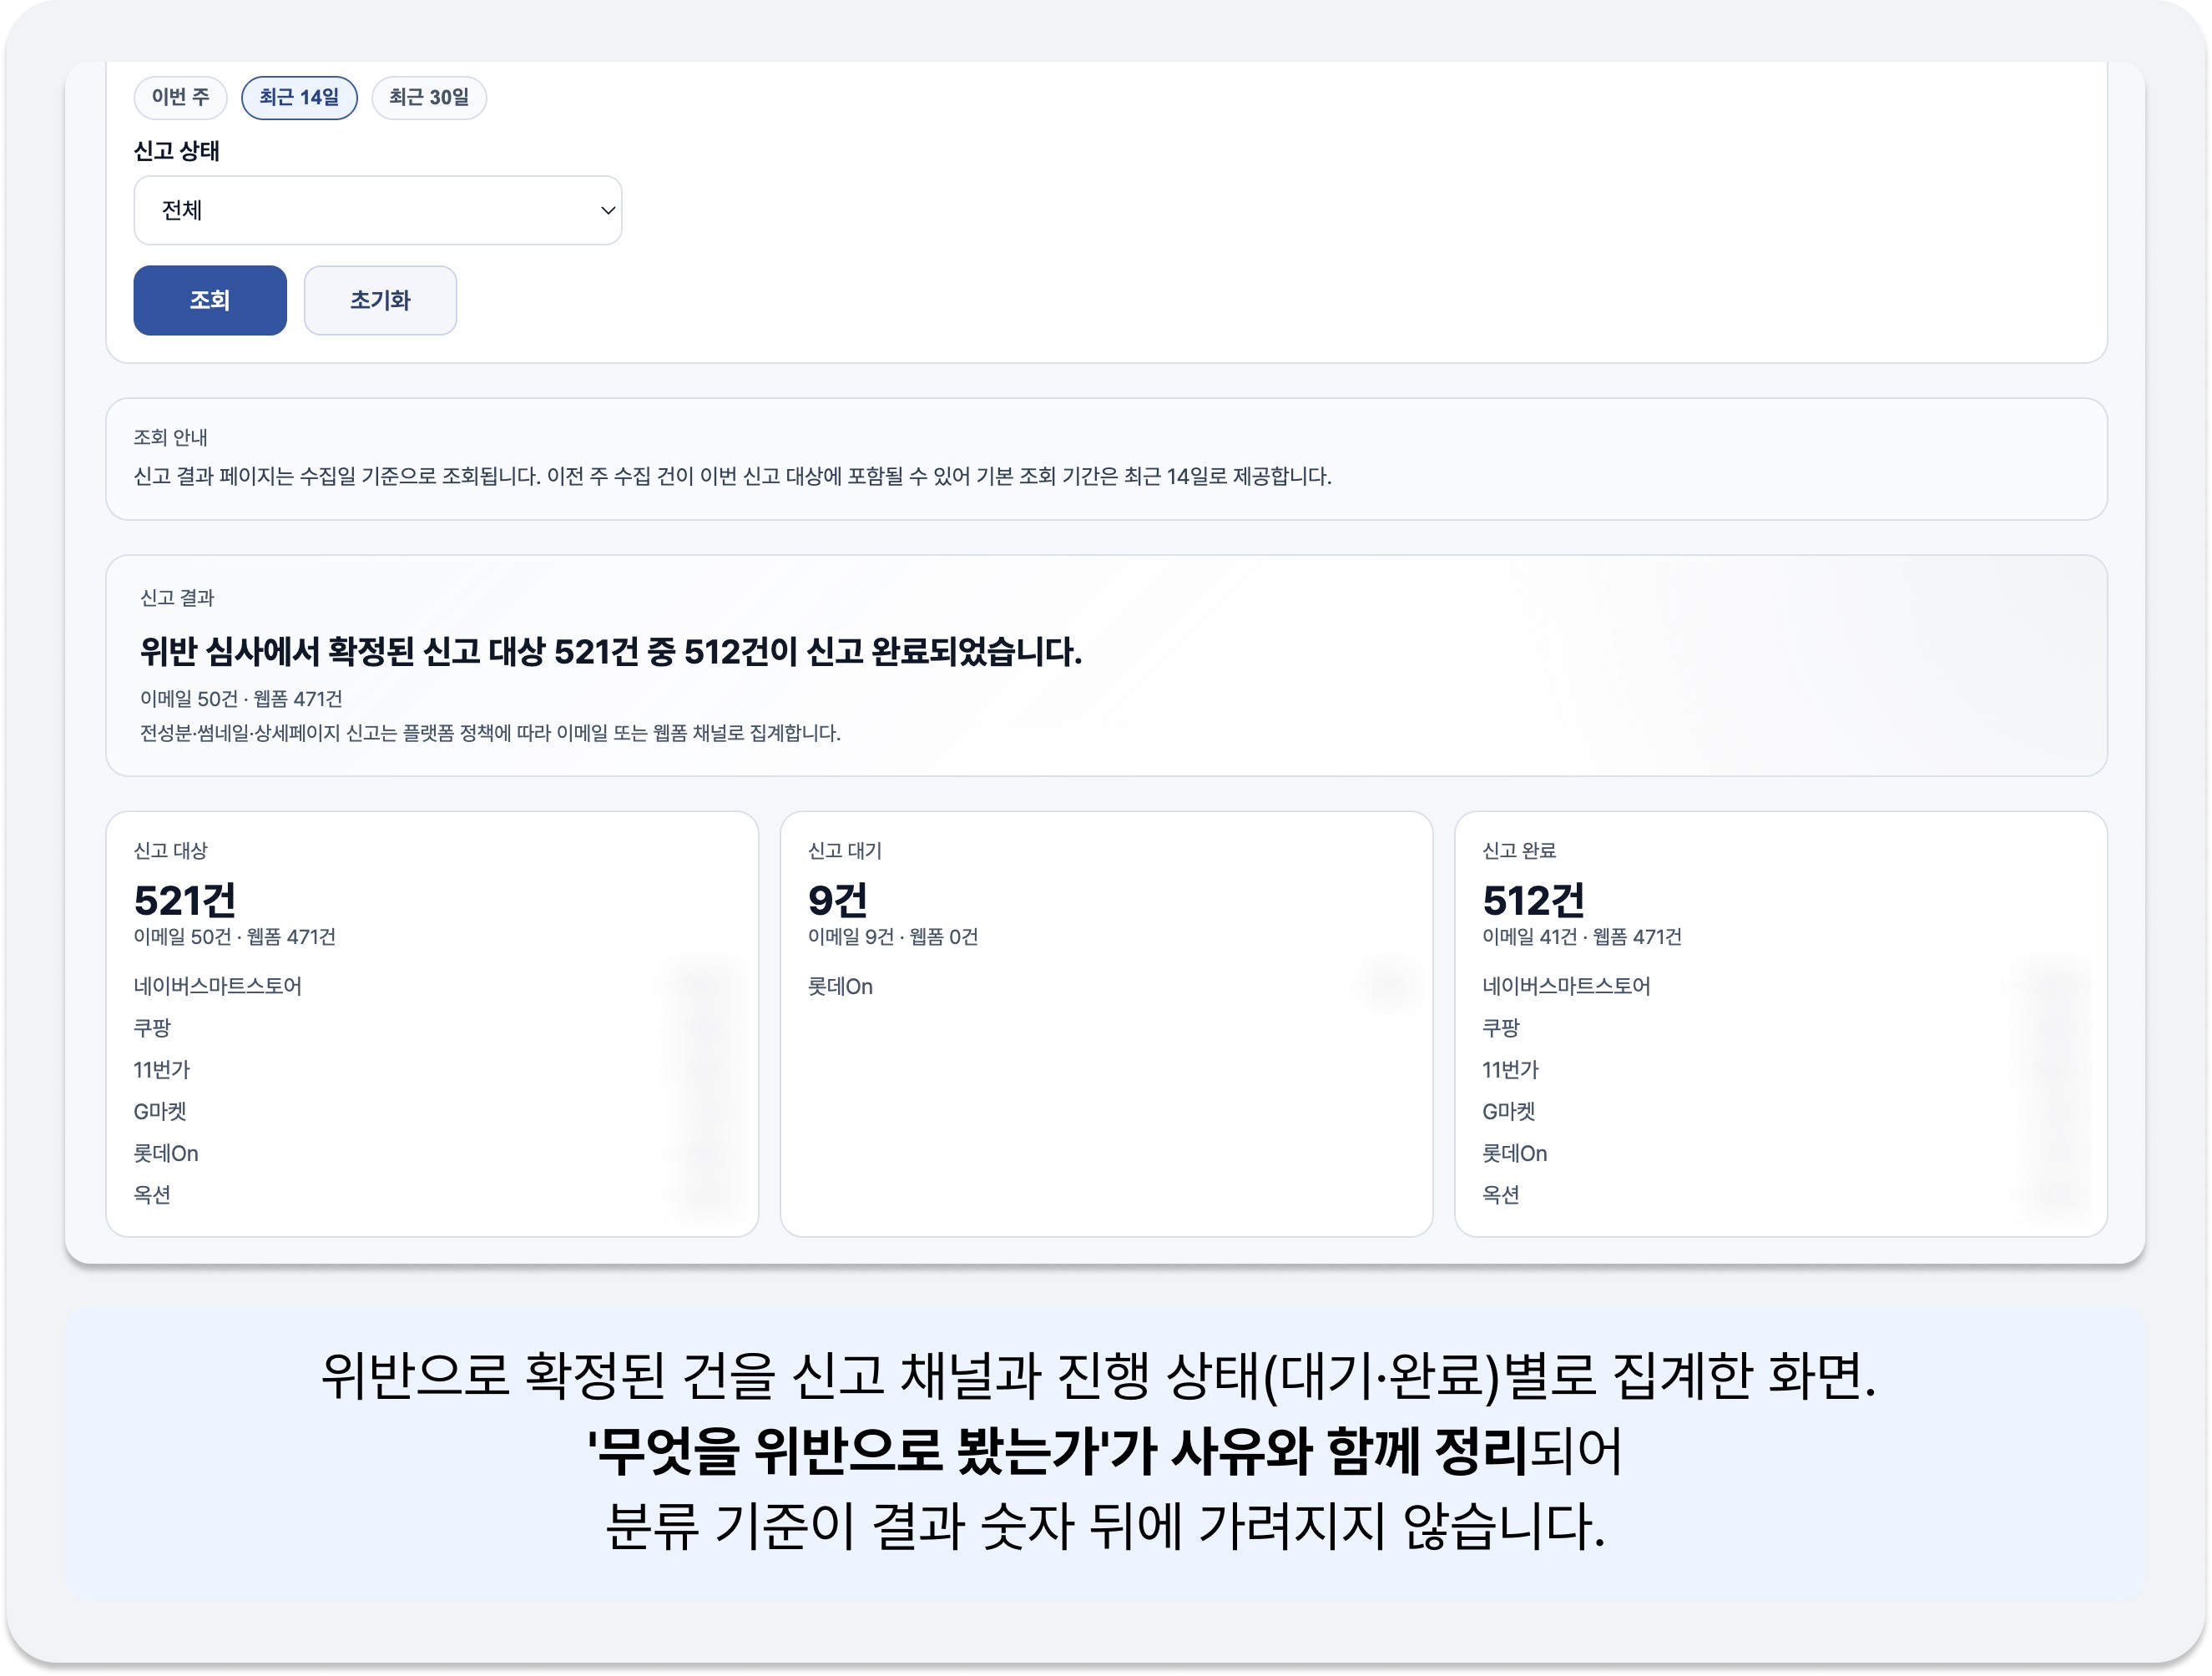
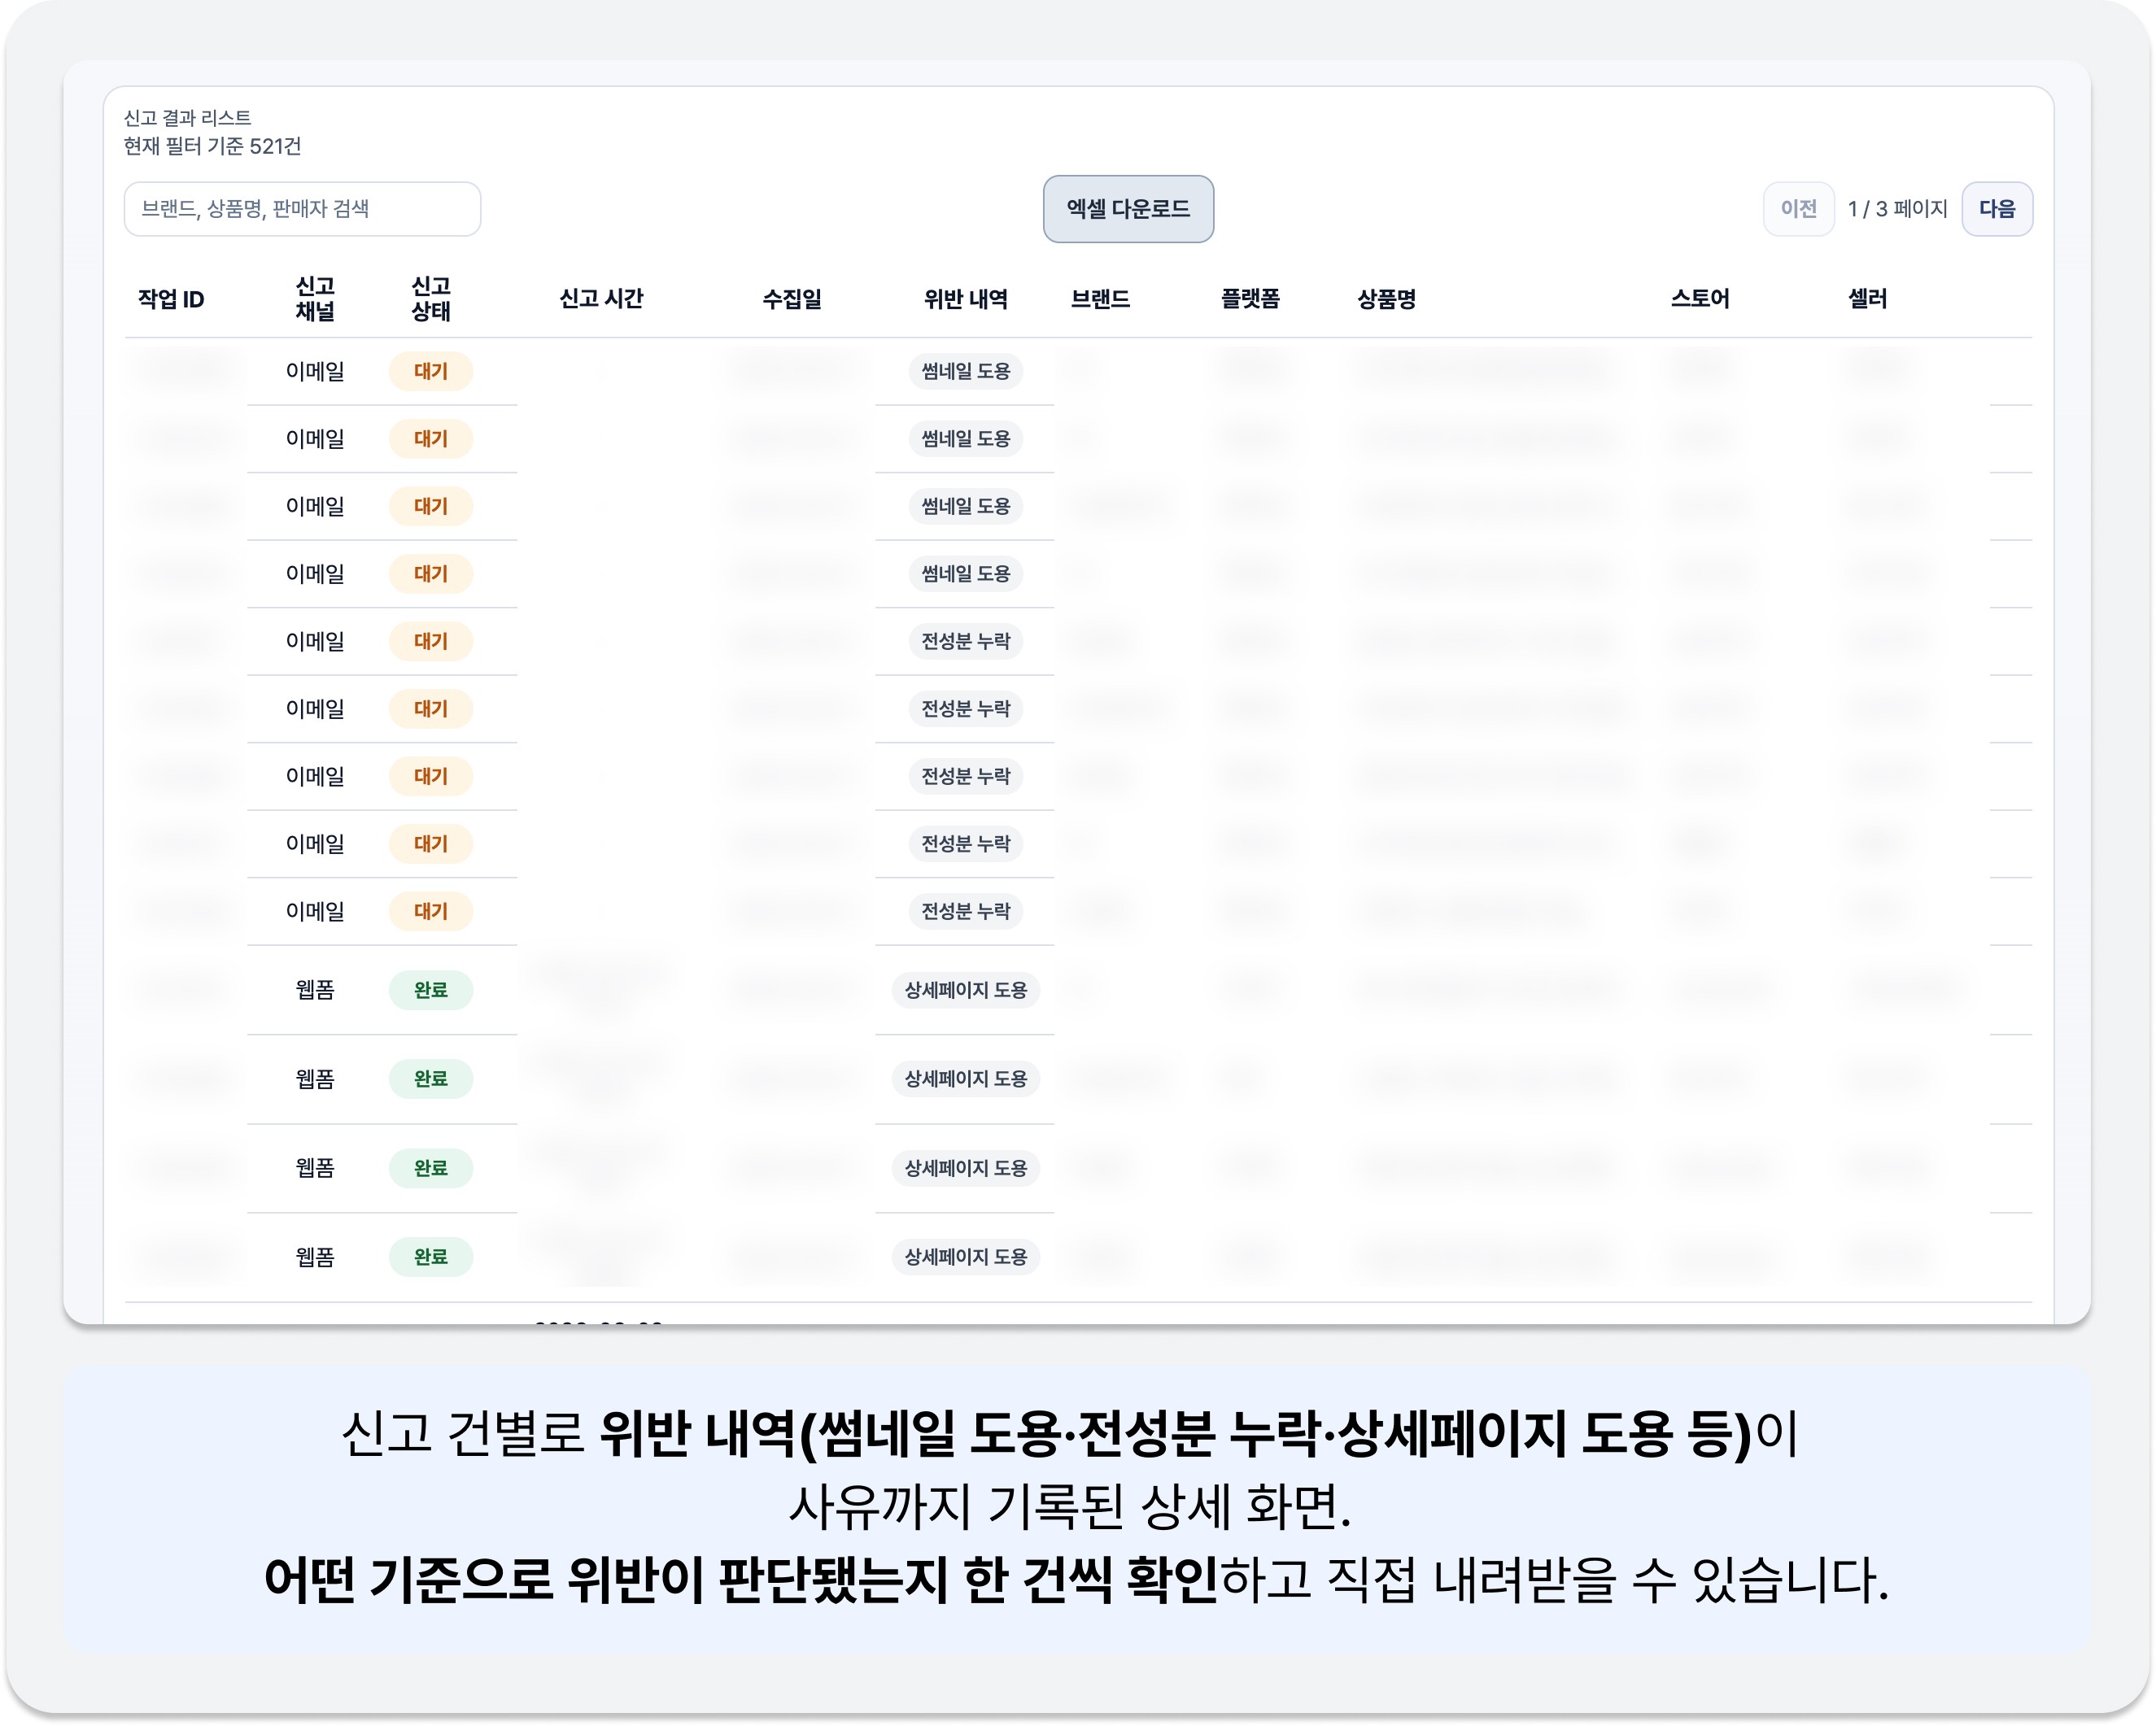
3️⃣ Third, "Can I directly download the data for the past 3 months?"
This is the most direct question showing whether data ownership belongs to the brand. If you can download and keep it, that data becomes an asset that remains with the brand even if you change solutions later.
Just by checking whether these three questions can be answered without hesitation, you can quickly judge whether the report you are currently receiving is a 'result summary' or 'market data.'
The Real Question to Ask Instead of "How many cases did you process this month?"
When reviewing a solution, the first question usually asked is, "How many cases do you process in a month?" This is because the number of processed cases is intuitive and easy to compare. However, as we have seen so far, the number of processed cases is only the numerator. Since the meaning is completely different depending on how much collection was behind the same 50 cases, the first thing to check before the number of processed cases is "How transparently can we look into the entire market?"
That transparency can be assessed with the three questions summarized earlier. Can we check the number of collected cases right now, can we get an explanation of the criteria for judging violations, and can we directly download the accumulated data? If these three are answered without hesitation, it is close to a structure where the entire process from collection to result is open. If any of them is difficult to verify, there is a high possibility that the concrete process of that stage is hidden from the brand's view.
In the end, the core is 'whether the brand holds its own market data directly in hand.' The final result report remains as a simple post-mortem record as time passes, but accumulated market data becomes an asset of evidence to grasp sellers' bypassing patterns and establish long-term distribution strategies. How many reports were processed is merely this month's performance, but how transparently you secure data determines the brand's future capability to proactively manage market risks. Whichever solution you choose, starting with this question will be a good beginning.